
Rainfall Return Periods Explained: How Rare Was That Storm?
On this page
Problem statement
After a big storm, the question is not only how much rain fell but how unusual it was — a "100-year storm" sounds very different from a "2-year storm", and the answer decides whether a drainage system failed or was overwhelmed by something it was never meant to handle. A return period is a statement about probability: the average interval between years in which a given amount is equalled or exceeded. Estimating it means fitting a distribution to a short record of extremes, and the answer depends heavily on the record, the distribution, and how the fit is done.
This page estimates return periods for daily rainfall at Houston's Intercontinental Airport from 55 years of GHCN-Daily records, places Hurricane Beryl's rain on 8 July 2024 on that curve, and compares the result with the return-period grid NOAA's MRMS system publishes for every storm.
Quick answer
Take each year's largest daily total, fit a generalised extreme value (GEV) distribution, and read return levels off it — giving the fit a sensible starting point:
annual_max = rain.groupby(rain.index.year).max().loc[COMPLETE_YEARS].loc[:2023]
shape, loc, scale = stats.genextreme.fit(annual_max.values, -0.3, loc=annual_max.median(), scale=annual_max.std() / 2)
for T in (2, 10, 25, 100):
    print(f"{T:3d}-year daily rainfall at IAH: {stats.genextreme.isf(1 / T, shape, loc, scale):5.0f} mm")
beryl = float(rain.loc["2024-07-08"])
print(f"8 July 2024: {beryl:.0f} mm, a {1 / stats.genextreme.sf(beryl, shape, loc, scale):.1f}-year daily total at the airport")
2-year daily rainfall at IAH: 107 mm
10-year daily rainfall at IAH: 207 mm
25-year daily rainfall at IAH: 284 mm
100-year daily rainfall at IAH: 448 mm
8 July 2024: 120 mm, a 2.5-year daily total at the airport
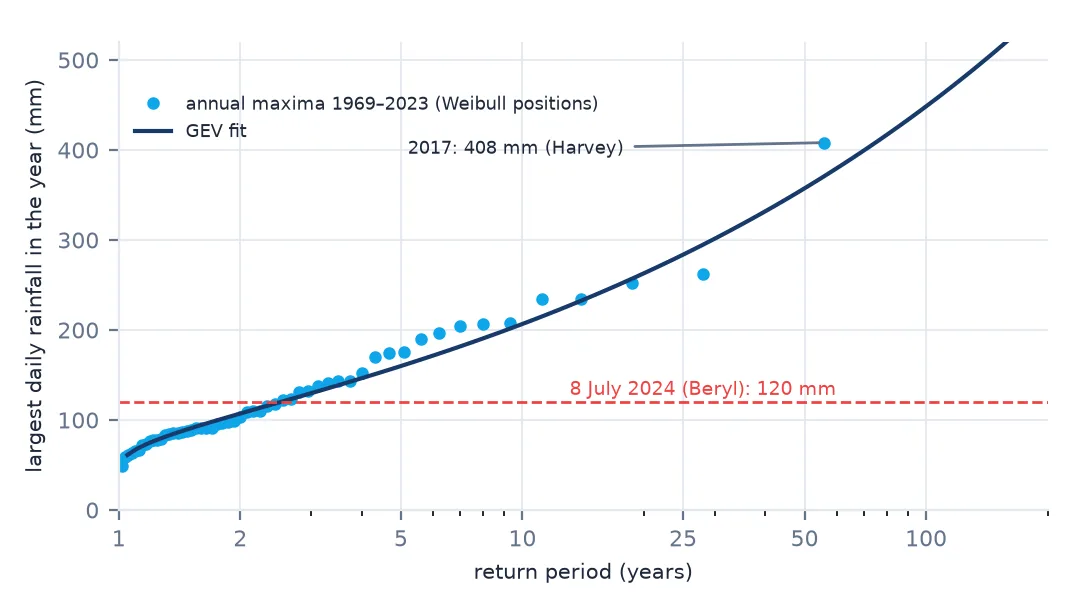
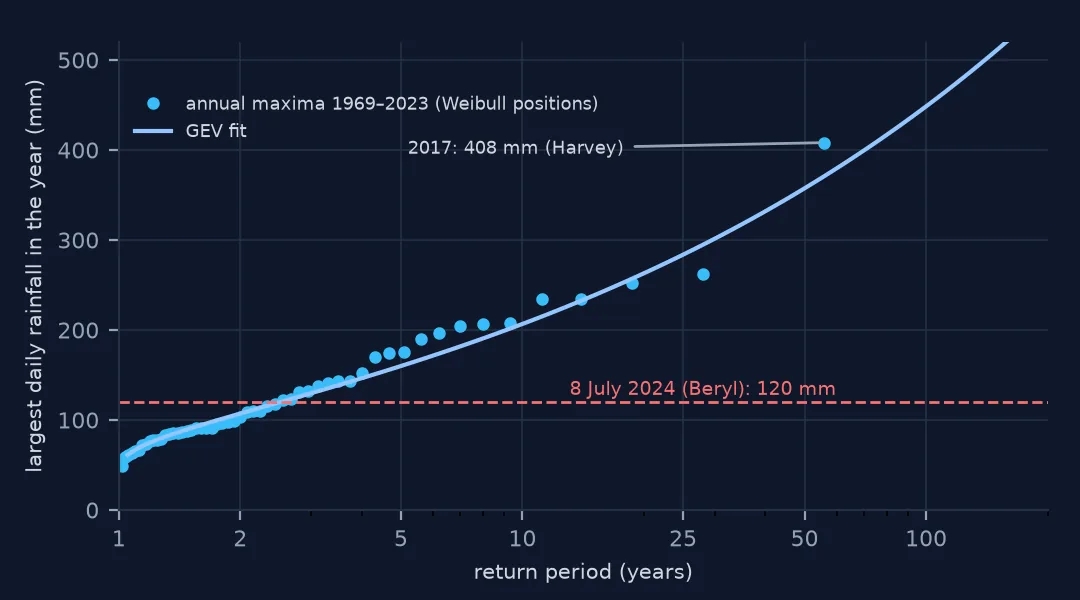
An annual-maximum series, a checked GEV fit, an event placed
1. Build an annual-maximum series
The record must be read in the right units and only complete years used. The per-station GHCN-Daily CSV stores precipitation in tenths of a millimetre:
print(f"{len(annual_max)} complete years, {annual_max.index.min()}-{annual_max.index.max()}; "
      f"smallest annual maximum {annual_max.min():.0f} mm, largest {annual_max.max():.0f} mm in {annual_max.idxmax()}")
55 complete years, 1969-2023; smallest annual maximum 49 mm, largest 408 mm in 2017
The largest is Hurricane Harvey's 2017 deluge. One storm far above all the others is typical of an extreme-value record, and it is exactly the value the fit has the least information about.
2. Fit a GEV — and check the fit
scipy.stats.genextreme.fit maximises the likelihood from a default starting point, and on this record the default fails:
bad = stats.genextreme.fit(annual_max.values)
print(f"default start: shape {bad[0]:.2f}, location {bad[1]:.1f}, scale {bad[2]:.1f} -> "
      f"100-year value {stats.genextreme.isf(0.01, *bad):,.0f} mm")
print(f"with a start:  shape {shape:.2f}, location {loc:.1f}, scale {scale:.1f} -> 100-year value {stats.genextreme.isf(0.01, shape, loc, scale):.0f} mm")
default start: shape -3.44, location 50.2, scale 3.1 -> 100-year value 6,829,036 mm
with a start: shape -0.31, location 93.7, scale 34.7 -> 100-year value 448 mm
Always plot the fit against the data — on a return-period axis, as in the figure — before trusting a number from it.
3. Compare distributions
The Gumbel distribution is the GEV with zero shape. It is often used for rainfall, and it disagrees about the tail:
g = stats.gumbel_r.fit(annual_max.values)
print(f"Harvey's {annual_max.max():.0f} mm: GEV return period {1 / stats.genextreme.sf(annual_max.max(), shape, loc, scale):.0f} years, "
      f"Gumbel {1 / stats.gumbel_r.sf(annual_max.max(), *g):,.0f} years")
print(f"negative log-likelihood: GEV {-stats.genextreme.logpdf(annual_max.values, shape, loc, scale).sum():.1f}, "
      f"Gumbel {-stats.gumbel_r.logpdf(annual_max.values, *g).sum():.1f}")
Harvey's 408 mm: GEV return period 75 years, Gumbel 1,687 years
negative log-likelihood: GEV 291.7, Gumbel 295.6
The two fit the bulk of the data almost equally well, and differ by a factor of twenty about the rarest event in it. A return period beyond the length of the record is an extrapolation, and its uncertainty is large.
4. Place an event on the curve
Beryl dropped 120 mm at IAH on 8 July — a two- to three-year daily total there. The storm's damage in Houston came mainly from wind and from where its heaviest rain fell, not from extreme rain at the airport.
5. Read the MRMS return-period grid
MRMS's FLASH system converts each accumulation into an average recurrence interval against NOAA Atlas 14 precipitation-frequency estimates, cell by cell:
ari = mrms_ari("20240709-000000")
print(f"IAH cell: {float(ari.sel(latitude=29.98, longitude=-95.36, method='nearest')):.1f}-year 24 h ARI")
cell_km2 = (111.32 * 0.01) ** 2 * np.cos(np.radians(ari.latitude))
for t in (10, 25, 100):
    print(f"land area at {t}-year ARI or more: {float((cell_km2 * (ari >= t)).sum()):,.0f} km²")
IAH cell: 4.4-year 24 h ARI
land area at 10-year ARI or more: 1,045 km²
land area at 25-year ARI or more: 3 km²
land area at 100-year ARI or more: 1 km²
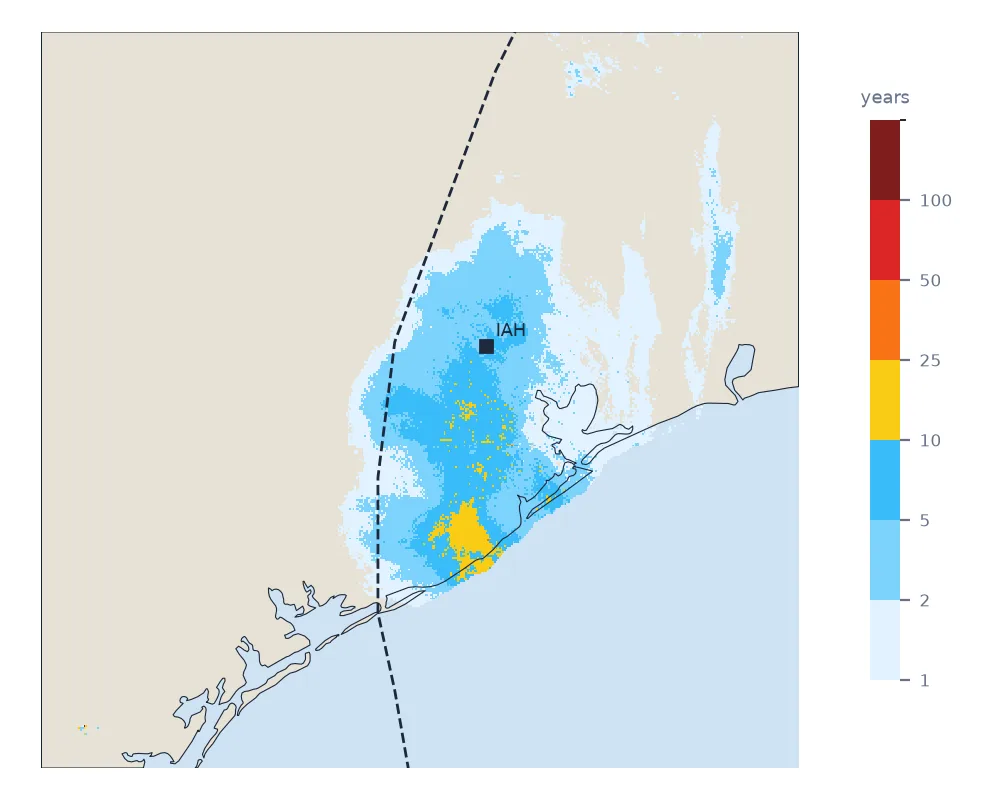
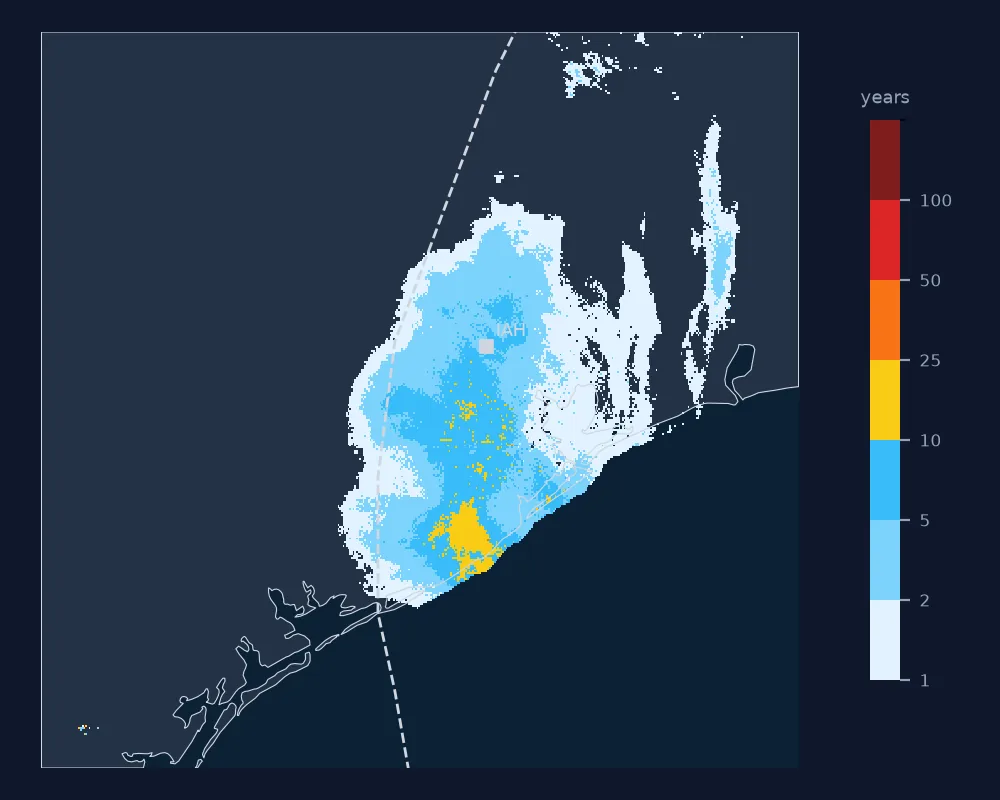
Around 1,000 km² of south-east Texas exceeded a 10-year 24-hour total; almost nothing exceeded 25 years. The single cell at the 200-year cap lies far inland, at the same spot where the radar-only rainfall had an artefact, which is a reminder that FLASH uses radar-only estimates.
An empirical check and bootstrap uncertainty
The data used on this page
GHCN-Daily station USW00012960, Houston Intercontinental Airport, from NOAA NCEI; MRMS FLASH QPE ARI 24 h, ending 00 UTC 9 July 2024, from the NOAA MRMS archive on AWS.
import gzip
import shutil
from pathlib import Path

import numpy as np
import pandas as pd
import requests
import xarray as xr
from scipy import stats

Path("data").mkdir(exist_ok=True)
URL = "https://www.ncei.noaa.gov/data/global-historical-climatology-network-daily/access/USW00012960.csv"
if not Path("data/USW00012960.csv").exists():
    # The file grows daily: the range printed below is the 2026-10-01 copy; only complete years enter the fit.
    Path("data/USW00012960.csv").write_bytes(requests.get(URL, timeout=300).content)
d = pd.read_csv("data/USW00012960.csv", usecols=["DATE", "PRCP", "PRCP_ATTRIBUTES"], parse_dates=["DATE"]).set_index("DATE")
qflag = d.PRCP_ATTRIBUTES.fillna(",,,").str.split(",").str[1]
rain = d.PRCP.where(qflag == "") / 10                          # tenths of mm in the per-station CSV
complete = rain.groupby(rain.index.year).apply(lambda x: x.notna().mean())
COMPLETE_YEARS = complete[complete > 0.95].index

def mrms_ari(stamp):
    name = f"MRMS_FLASH_QPE_ARI24H_00.00_{stamp}.grib2"
    if not Path("data", name).exists():
        url = f"https://noaa-mrms-pds.s3.amazonaws.com/CONUS/FLASH_QPE_ARI24H_00.00/{stamp[:8]}/{name}.gz"
        Path("data", name + ".gz").write_bytes(requests.get(url, timeout=300).content)
        with gzip.open(Path("data", name + ".gz")) as f, open(Path("data", name), "wb") as o:
            shutil.copyfileobj(f, o)
    q = xr.open_dataset(Path("data", name), engine="cfgrib", decode_timedelta=True, backend_kwargs={"indexpath": ""})["unknown"]
    q = q.where(q >= 0).sel(latitude=slice(31.6, 27.8), longitude=slice(262, 266.5))
    return q.assign_coords(longitude=q.longitude - 360)

print(rain.index.min().date(), "to", rain.index.max().date(), len(COMPLETE_YEARS), "complete years")
1969-06-01 to 2026-09-26 58 complete years
Example 1: an empirical check without a distribution
Plotting positions estimate return periods from ranks alone — no fit, no extrapolation:
srt = annual_max.sort_values(ascending=False)
T_emp = (len(srt) + 1) / np.arange(1, len(srt) + 1)
print(pd.DataFrame({"year": srt.index[:5], "mm": srt.values[:5].round(0), "empirical T (yr)": T_emp[:5].round(1)}).to_string(index=False))
year mm empirical T (yr)
2017 408.0 56.0
1989 263.0 28.0
2016 252.0 18.7
1984 235.0 14.0
2019 234.0 11.2
Example 2: uncertainty by bootstrap
Refitting to resampled records shows how uncertain a 100-year value is from 55 years:
rng = np.random.default_rng(0)
boot = []
for _ in range(200):
    s = rng.choice(annual_max.values, len(annual_max), replace=True)
    p = stats.genextreme.fit(s, -0.3, loc=np.median(s), scale=s.std() / 2)
    boot.append(stats.genextreme.isf(0.01, *p))
print(f"100-year daily rainfall at IAH: {stats.genextreme.isf(0.01, shape, loc, scale):.0f} mm, "
      f"bootstrap 5th-95th percentile {np.percentile(boot, 5):.0f}-{np.percentile(boot, 95):.0f} mm")
100-year daily rainfall at IAH: 448 mm, bootstrap 5th-95th percentile 300-668 mm
What a T-year return period means
A T-year return period means a probability of 1/T of being equalled or exceeded in any one year. It does not mean the event happens once every T years, and over 30 years a 100-year event has a 1 − 0.99³⁰ = 26% chance of occurring at least once. Estimating it requires a model of the tail of the distribution, because the events of interest are rarer than most records are long.
The generalised extreme value distribution is the theoretical model for annual maxima, and with 55 years it fits the observed bulk of IAH's record well. Its tail — what it says about events larger than anything observed — depends on a shape parameter that the data constrain weakly, which is why a bootstrap gives a wide range for the 100-year value and why Gumbel and GEV disagree so strongly about Harvey. Precipitation-frequency atlases such as NOAA Atlas 14 pool many stations regionally to narrow that uncertainty; MRMS's FLASH grids use those atlases to assign a return period to every cell of every storm.
Units, complete years and extrapolation
- Units: per-station GHCN-Daily CSV precipitation is in tenths of a millimetre.
- Complete years only; a missing storm day lowers the annual maximum.
- Check the fit visually; default optimiser starts can fail.
- Do not extrapolate far beyond the record length without regional information.
- A day is not 24 hours: a calendar-day maximum understates the worst 24-hour total.
- FLASH ARI uses radar-only QPE, so radar artefacts become "rare" rainfall.
Internal links
- How to map storm-total rainfall — Beryl's totals
- How to build rainfall intensity–duration curves — shorter durations
- How to read MRMS rainfall from GRIB2 — the grids
- How to analyse snow depth from GHCN-Daily — station records and flags
- Rainfall accumulation has gaps — missing data in totals
FAQ
What does a 100-year rainfall mean?
A total with a 1% chance of being equalled or exceeded in any year — not one that occurs once a century.
How do I calculate rainfall return periods in Python?
Build a series of annual maxima from complete years, fit scipy.stats.genextreme (giving a starting point), and use isf(1/T, ...) for return levels or 1/sf(x, ...) for the return period of a value.
How rare was Hurricane Beryl's rainfall in Houston?
At Houston Intercontinental Airport, 8 July 2024's 120 mm was about a 2.5-year daily total; MRMS put most of south-east Texas below a 10-year 24-hour ARI.
Why do GEV and Gumbel give different return periods?
They share the bulk of the distribution and differ in the tail. For Harvey's 408 mm at IAH the GEV gives about 75 years and the Gumbel over 1,000.