
How to Read DWD RADOLAN Radar Rainfall in Python
On this page
Problem statement
RADOLAN is the German weather service's (DWD) radar composite, adjusted to rain gauges every hour. It covers Germany on a 1 km grid back to 2005 and is free on the DWD Open Data server. It is also an unusual format. Each file is a short ASCII header followed by 900 × 900 16-bit integers. Four of those bits are flags, and the grid sits on a polar stereographic projection on a sphere. A GIS will not open it without help.
This page reads RADOLAN RW, the hourly gauge-adjusted product, for the 24 hours of 14 July 2021, when rain over the Eifel caused the Ahr valley flood. It decodes the header and flags, georeferences the grid, writes a GeoTIFF, and checks the result against DWD's own rain gauges.
Quick answer
Split at the end-of-header byte, read little-endian 16-bit integers, keep the low 12 bits, and mask the no-data flag:
def read_radolan(path):
    raw = Path(path).read_bytes()
    end = raw.index(b"\x03")                                    # ETX ends the ASCII header
    header = raw[:end].decode("latin-1")
    cells = np.frombuffer(raw[end + 1:], dtype="<u2").reshape(900, 900)   # row 0 is the southern edge
    scale = 10 ** int(re.search(r"PR E(-?\d+)", header).group(1))          # E-01 -> 0.1 mm
    mm = np.where(cells & 0x2000, np.nan, (cells & 0x0FFF) * scale)
    return header, cells, mm

header, cells, mm = read_radolan(FILES[0])
print(header[:60])
print(f"{np.isfinite(mm).sum():,} cells with data, max {np.nanmax(mm):.1f} mm in the hour")
RW140650100000721BY1620153VS 3SW 2.29.1PR E-01INT 60GP 90
673,467 cells with data, max 37.3 mm in the hour
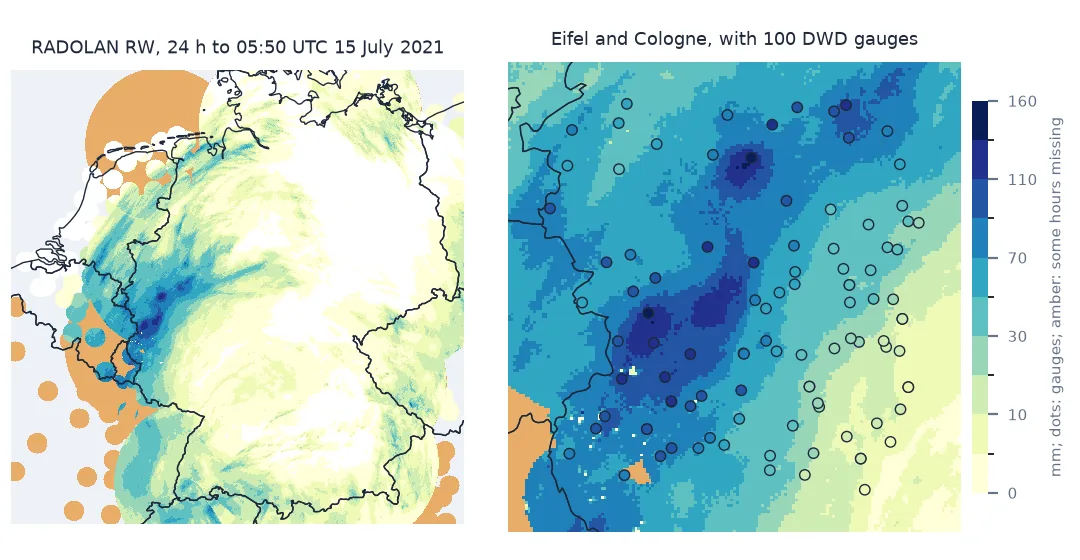
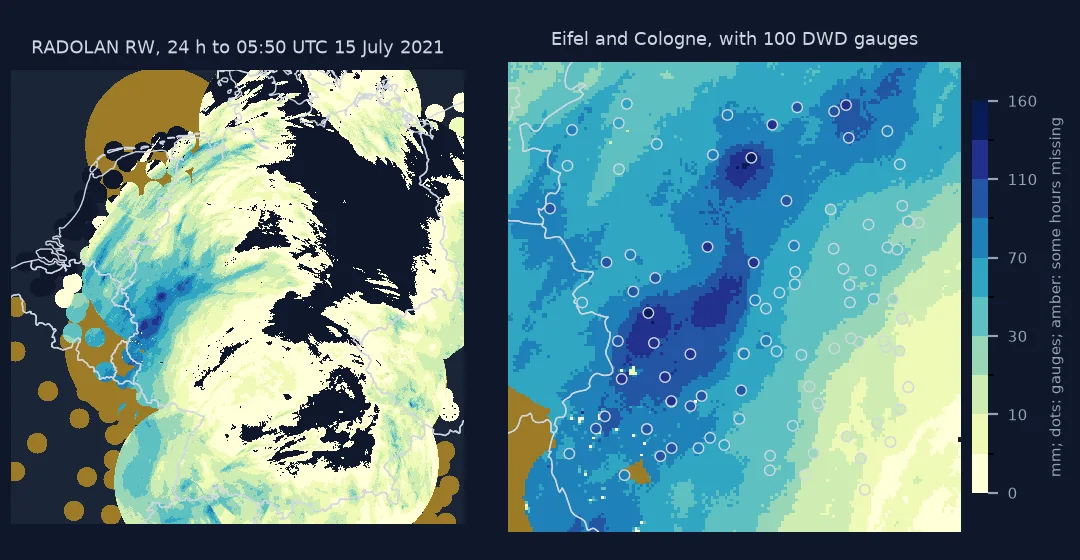
Header, flag bits, daily sums and gaps, georeferencing
1. Read the header
The header is a run of two-letter keys followed by values. It gives the product, the end time of the hour, the precision, the grid size and the radars that went into the composite:
def parse_header(h):
    return {"product": h[:2], "end": pd.to_datetime(h[2:8] + h[13:17], format="%d%H%M%m%y", utc=True),
            "precision": re.search(r"PR (E-?\d+)", h).group(1), "interval_min": int(re.search(r"INT\s*(\d+)", h).group(1)),
            "grid": re.search(r"GP\s*(\d+x\s*\d+)", h).group(1).replace(" ", ""),
            "radars": re.search(r"<([^>]*)>", h).group(1).split(",")}

info = parse_header(header)
print({k: v for k, v in info.items() if k != "radars"}, f"{len(info['radars'])} radars")
{'product': 'RW', 'end': Timestamp('2021-07-14 06:50:00+0000', tz='UTC'), 'precision': 'E-01', 'interval_min': 60, 'grid': '900x900'} 17 radars
2. Decode the flag bits
The low 12 bits hold the value. Above them are four flags: secondary data (0x1000), no data (0x2000), a negative value (0x4000) and clutter (0x8000). Count them before trusting the numbers:
for name, bit in (("secondary", 0x1000), ("no data", 0x2000), ("negative", 0x4000), ("clutter", 0x8000)):
    print(f"{name:9s} 0x{bit:04X}: {int((cells & bit > 0).sum()):,} cells")
secondary 0x1000: 44,409 cells
no data 0x2000: 136,533 cells
negative 0x4000: 0 cells
clutter 0x8000: 0 cells
In RW, every no-data cell is outside radar coverage or in a gap, not dry ground, so it must become NaN, not zero. Decoded this way, the 19:50 UTC file agrees cell for cell with wradlib.io.read_radolan_composite, the reference reader, if you prefer a library.
3. Sum the day, and count the gaps
DWD's precipitation day runs from 05:50 UTC to 05:50 UTC, and RW files are named for the end of their hour, so the 24 files ending 06:50 on 14 July to 05:50 on 15 July make 14 July's total. A cell missing in any hour cannot have a complete total:
stack = np.stack([read_radolan(f)[2] for f in FILES])
total = stack.sum(axis=0)                                      # NaN wherever any hour is missing
missing = np.isnan(stack).sum(axis=0)
print(f"complete: {(missing == 0).sum():,} cells; some hours missing: {((missing > 0) & (missing < 24)).sum():,}; "
      f"never covered: {(missing == 24).sum():,}")
print(f"24 h maximum {np.nanmax(total):.1f} mm")
for f in FILES:
    h = parse_header(read_radolan(f)[0])
    if len(h["radars"]) < 17:
        print(h["end"].strftime("%d %H:%M"), "missing:", sorted(set(ALL_RADARS) - set(h["radars"])))
complete: 601,507 cells; some hours missing: 72,252; never covered: 136,241
24 h maximum 135.8 mm
14 07:50 missing: ['asb']
14 08:50 missing: ['asb']
14 22:50 missing: ['nhb']
14 23:50 missing: ['nhb']
15 00:50 missing: ['nhb']
15 01:50 missing: ['nhb']
15 02:50 missing: ['nhb']
15 03:50 missing: ['nhb']
15 04:50 missing: ['nhb']
15 05:50 missing: ['nhb']
Two radars dropped out of the composite during the day: Borkum (asb) for two hours in the morning, and Neuheilenbach (nhb) in the Eifel — the radar nearest the flood — for the last eight hours. Where no other radar covered the ground, those cells have no total.
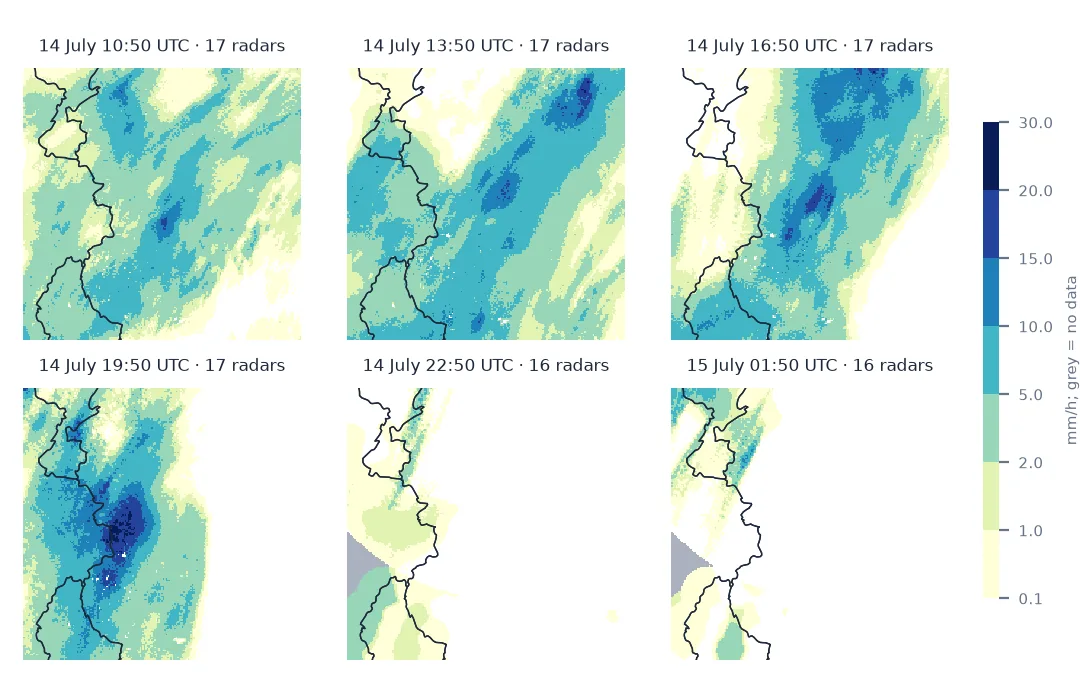
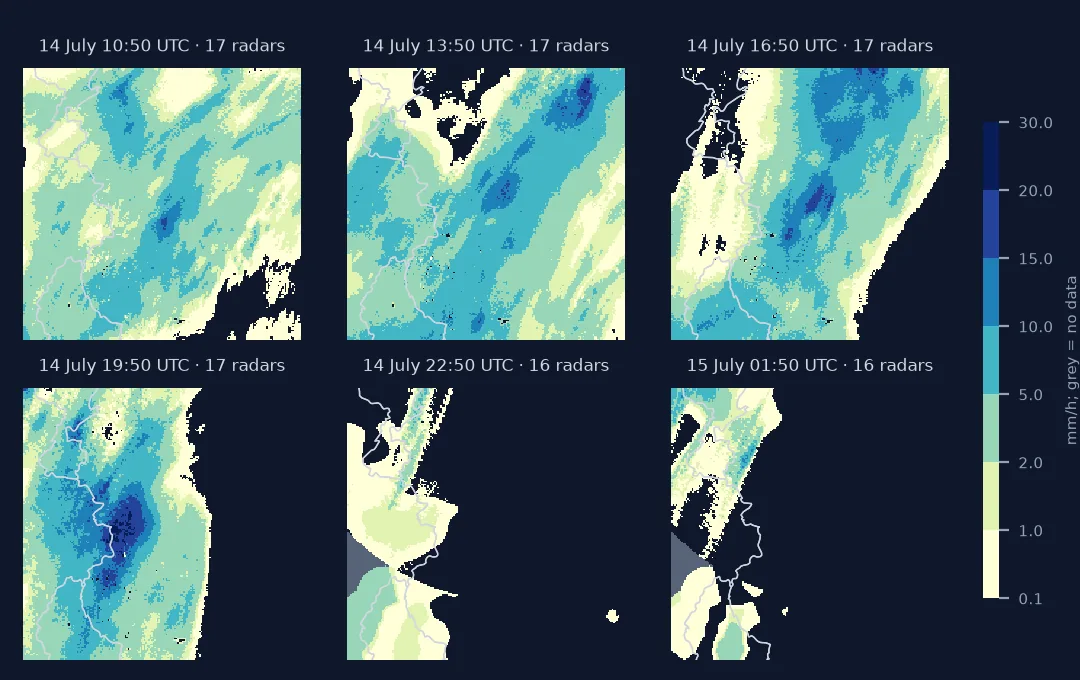
4. Georeference the grid
RADOLAN uses a polar stereographic projection true at 60° N, centred on 10° E, on a sphere of radius 6,370.04 km. The 900 × 900 grid's lower-left corner is at x = −523,462 m, y = −4,658,645 m:
STERE = "+proj=stere +lat_0=90 +lat_ts=60 +lon_0=10 +a=6370040 +b=6370040 +units=m +no_defs"
X0, Y0 = -523_462.2, -4_658_644.7
to_ll = Transformer.from_crs(STERE, 4326, always_xy=True)
for label, (col, row) in (("lower-left corner", (0, 0)), ("upper-right corner", (900, 900))):
    lon, lat = to_ll.transform(X0 + col * 1000, Y0 + row * 1000)
    print(f"{label}: {lat:.4f} N, {lon:.4f} E")
r, c = np.unravel_index(np.nanargmax(total), total.shape)
lon, lat = to_ll.transform(X0 + (c + 0.5) * 1000, Y0 + (r + 0.5) * 1000)
print(f"wettest cell: {np.nanmax(total):.1f} mm at {lat:.3f} N, {lon:.3f} E")
wrong = Transformer.from_crs(STERE.replace("+a=6370040 +b=6370040", "+ellps=WGS84"), 4326, always_xy=True)
lon_w, lat_w = wrong.transform(X0 + (c + 0.5) * 1000, Y0 + (r + 0.5) * 1000)
print(f"same cell on the WGS84 ellipsoid: {lat_w:.3f} N, {lon_w:.3f} E "
      f"({Geod(ellps='WGS84').inv(lon, lat, lon_w, lat_w)[2] / 1000:.1f} km away)")
lower-left corner: 46.9526 N, 3.5889 E
upper-right corner: 54.7405 N, 15.7208 E
wettest cell: 135.8 mm at 50.968 N, 6.966 E
same cell on the WGS84 ellipsoid: 51.083 N, 6.966 E (12.8 km away)
Using the WGS84 ellipsoid instead of the sphere — the usual default — moves every cell about 13 km north, which is several catchments in the Eifel. The corners agree to four decimals with the grid wradlib.georef.get_radolan_grid builds, and the wettest cell lies on the north side of Cologne, beside the Köln-Stammheim gauge that recorded 153.5 mm.
5. Write a GeoTIFF
Row 0 is the southern edge, so flip the array before writing a north-up raster:
profile = {"driver": "GTiff", "height": 900, "width": 900, "count": 1, "dtype": "float32", "nodata": np.nan,
           "crs": CRS.from_proj4(STERE), "transform": from_origin(X0, Y0 + 900 * 1000, 1000, 1000), "compress": "deflate"}
with rasterio.open("data/radolan_rw_20210714.tif", "w", **profile) as dst:
    dst.write(np.flipud(total).astype("float32"), 1)
with rasterio.open("data/radolan_rw_20210714.tif") as src:
    print(src.crs.to_proj4()[:60], src.res, f"{Path('data/radolan_rw_20210714.tif').stat().st_size / 1e6:.1f} MB")
    stammheim = gauges[gauges.name.str.contains("Stammheim")].iloc[0]
    xy = Transformer.from_crs(4326, src.crs, always_xy=True).transform(stammheim.lon, stammheim.lat)
    print(f"{stammheim['name']}: {next(src.sample([xy]))[0]:.1f} mm in the GeoTIFF")
+proj=stere +lat_0=90 +lat_ts=60 +lon_0=10 +x_0=0 +y_0=0 +R= (1000.0, 1000.0) 0.9 MB
Köln-Stammheim: 124.5 mm in the GeoTIFF
Checking RADOLAN against the rain gauges
The data used on this page
RADOLAN RW for July 2021 from DWD Open Data, and daily precipitation from DWD's climate station network (more_precip/historical), both under the DWD open-data terms.
import io
import re
import tarfile
import zipfile
from pathlib import Path

import numpy as np
import pandas as pd
import rasterio
import requests
from pyproj import Geod, Transformer
from rasterio.crs import CRS
from rasterio.transform import from_origin

Path("data/rw").mkdir(parents=True, exist_ok=True)
TAR = Path("data/RW202107.tar.gz")
if not TAR.exists():
    TAR.write_bytes(requests.get("https://opendata.dwd.de/climate_environment/CDC/grids_germany/hourly/radolan/"
                                 "historical/bin/2021/RW202107.tar.gz", timeout=600).content)
with tarfile.open(TAR) as t:
    wanted = [m for m in t.getmembers() if "2107140650" <= m.name.split("-")[2] <= "2107150550"]
    t.extractall("data/rw", members=wanted, filter="data")
FILES = sorted(Path("data/rw").glob("raa01-rw_10000-21071*"))
FILES = [f for f in FILES if "2107140650" <= f.name.split("-")[2] <= "2107150550"]
ALL_RADARS = ["asb", "boo", "ros", "hnr", "umd", "pro", "ess", "fld", "drs", "neu", "nhb", "oft", "eis", "tur", "isn", "fbg", "mem"]

DWD = "https://opendata.dwd.de/climate_environment/CDC/observations_germany/climate/daily/more_precip/historical/"
listing = requests.get(DWD + "RR_Tageswerte_Beschreibung_Stationen.txt", timeout=120).content.decode("latin-1").splitlines()[2:]
stations = pd.DataFrame([dict(id=p[0], start=int(p[1]), end=int(p[2]), lat=float(p[4]), lon=float(p[5]), name=" ".join(p[6:-2]))
                         for p in (line.split() for line in listing if line.strip())])
stations = stations[(stations.start <= 20210714) & (stations.end >= 20210716)
                    & stations.lat.between(50.0, 51.2) & stations.lon.between(6.0, 7.8)]
zips = {n.split("_")[2]: n for n in re.findall(r'href="(tageswerte_RR_\d{5}_\d{8}_\d{8}_hist\.zip)"',
                                                 requests.get(DWD, timeout=120).text)}
Path("data/rr").mkdir(exist_ok=True)
rows = []
for sid in stations.id:
    if sid not in zips:
        continue
    path = Path("data/rr") / zips[sid]
    if not path.exists():
        path.write_bytes(requests.get(DWD + zips[sid], timeout=120).content)
    z = zipfile.ZipFile(path)
    d = pd.read_csv(z.open(next(n for n in z.namelist() if n.startswith("produkt"))), sep=";", skipinitialspace=True)
    d.columns = d.columns.str.strip()
    v = d.set_index("MESS_DATUM").RS
    rows.append({"id": sid, "d14": v.get(20210714, np.nan), "d15": v.get(20210715, np.nan)})
gauges = pd.DataFrame(rows).merge(stations, on="id")
print(f"{len(FILES)} hourly RW files; {len(gauges)} DWD gauges in 50.0-51.2 N, 6.0-7.8 E")
24 hourly RW files; 112 DWD gauges in 50.0-51.2 N, 6.0-7.8 E
Example 1: check against the rain gauges
RW is already adjusted to gauges, many of them these same stations, so this checks the reading and georeferencing more than the radar. Sample the cell under each gauge:
print("DWD -999 (missing) on 14 July:", gauges[gauges.d14 < 0].name.tolist())
print(f"median value dated 14 July: {gauges[gauges.d14 >= 0].d14.median():.1f} mm; dated 15 July: {gauges.d15.median():.1f} mm")
g = gauges[gauges.d14 >= 0].copy()
x, y = Transformer.from_crs(4326, STERE, always_xy=True).transform(g.lon.values, g.lat.values)
g["radolan"] = total[((y - Y0) // 1000).astype(int), ((x - X0) // 1000).astype(int)]
k = g.dropna(subset=["radolan"])
print(f"{len(k)} gauges: r = {np.corrcoef(k.d14, k.radolan)[0, 1]:.2f}, median RADOLAN/gauge {(k.radolan / k.d14).median():.2f}, "
      f"mean difference {(k.radolan - k.d14).mean():+.1f} mm")
print(k.nlargest(4, "d14")[["name", "d14", "radolan"]].round(1).to_string(index=False))
DWD -999 (missing) on 14 July: ['Ahrbrück', 'Eschweiler-Weisweiler']
median value dated 14 July: 61.6 mm; dated 15 July: 0.1 mm
99 gauges: r = 0.97, median RADOLAN/gauge 0.86, mean difference -10.8 mm
name d14 radolan
Köln-Stammheim 153.5 124.5
Kall-Sistig 144.8 123.2
Dahlem-Schmidtheim 129.2 117.9
Schneifelforsthaus 124.1 107.5
Example 2: hourly rain at the wettest gauge
top = k.loc[k.d14.idxmax()]
xk, yk = Transformer.from_crs(4326, STERE, always_xy=True).transform(top.lon, top.lat)
row, col = int((yk - Y0) // 1000), int((xk - X0) // 1000)
hourly = pd.Series(stack[:, row, col], index=[parse_header(read_radolan(f)[0])["end"].strftime("%H:%M") for f in FILES])
print(f"{top['name']} (gauge {top.d14:.1f} mm), RADOLAN cell: {hourly.sum():.1f} mm; wettest hour {hourly.max():.1f} mm ending {hourly.idxmax()} UTC; "
      f"{(hourly >= 1).sum()} hours with 1 mm or more")
Köln-Stammheim (gauge 153.5 mm), RADOLAN cell: 124.5 mm; wettest hour 25.4 mm ending 17:50 UTC; 13 hours with 1 mm or more
A gauge-adjusted composite of seventeen radars
RADOLAN takes the DWD's 17 C-band radars and builds a composite on a common 1 km grid. Each hour, its precipitation estimate is adjusted to the hourly totals from automatic gauges. RW is the hourly result. SF is a 24-hour sum of it, and YW is a 5-minute version. The format dates from an era of tight storage: 12 bits of value at a fixed precision and 4 bits of flags, packed into one 16-bit word per cell. The projection is a stereographic plane on a sphere rather than the WGS84 ellipsoid, so it needs its own PROJ string rather than an EPSG code.
Read correctly, RW agrees with DWD's independent daily gauges at r = 0.97 for this event, though about 14% low — the heaviest convective totals in the Eifel are underestimated even after adjustment. Read carelessly, it can mislead: summing missing cells as zero, flipping the rows, or using the WGS84 ellipsoid would shift or blank exactly the part of the map where the flood began.
Other grids, RADKLIM and hour labels
- Not every RADOLAN product uses the 900 × 900 grid; read
GPfrom the header and check the corners before reusing this georeferencing. - RADOLAN climate reanalysis (RADKLIM) is a separate, more homogeneous archive for long-term statistics.
- Hourly files end at :50, matching the gauge network's 05:50 UTC day boundary; aligning to full hours shifts by ten minutes.
- Precision varies by product (
E-01,E-02); never hard-code the scale factor. -999in DWD station data means missing, not negative rain.- Composites change membership hourly; the radar list in the header says which radars contributed.
Internal links
- How to estimate rainfall from radar — the US equivalent from raw reflectivity
- How to read MRMS rainfall in Python — NOAA's gauge-adjusted composite
- How to compare radar rainfall with gauges — matching windows
- Rainfall totals come out wrong — gaps in a composite
- Polar stereographic projections explained — the grid
FAQ
What is RADOLAN RW?
The DWD's hourly, gauge-adjusted radar precipitation composite for Germany on a 900 × 900 km grid at 1 km resolution, in 0.1 mm.
How do I open RADOLAN binary files in Python?
Split the file at the first \x03 byte, read the rest as little-endian uint16, mask cells with bit 0x2000 set, and multiply the low 12 bits by the header's precision. Or use wradlib.io.read_radolan_composite.
What projection does RADOLAN use?
Polar stereographic, true at 60° N, central meridian 10° E, on a sphere of radius 6,370.04 km; lower-left corner at (−523,462 m, −4,658,645 m).
Why do some RADOLAN cells have no data for part of a day?
A radar dropped out of the composite and no other radar covered that area; the header lists which radars contributed each hour.