
Georeferenced Map Has a Black Border or Hides Other Layers
On this page
Problem statement
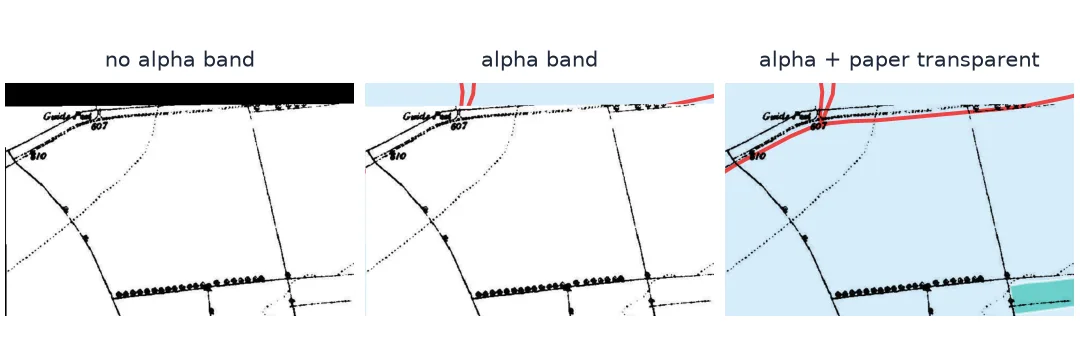
A warped old map almost never fills its rectangle. The sheet was rotated to fit the grid, so the corners of the new raster lie outside the scan, and GDAL fills them with 0 — black wedges around the map that cover whatever is underneath. The usual fix, declaring 0 as "no data", then makes the map's own black ink transparent: churches and lettering turn into holes. And even with the border gone, the white paper of the old map hides every modern layer below it.
This page reproduces all three on the Ordnance Survey six-inch sheet of Oakham (1884–1891), shows the right fix for each, and repairs a file that was already warped without one — without going back to the scan.
Quick answer
Warp with an alpha band so "outside the sheet" is its own channel, never a pixel value. To see modern layers through the paper, make the alpha follow the ink:
src = gdal.Warp("data/oakham_alpha.tif", "data/os_gcps.vrt", dstSRS="EPSG:27700", polynomialOrder=1,
                xRes=1, yRes=1, resampleAlg="cubic", dstAlpha=True, creationOptions=["COMPRESS=DEFLATE", "TILED=YES"])
grey, alpha = src.ReadAsArray()
ink_alpha = np.minimum(alpha, 255 - grey)                    # paper transparent, ink opaque, outside clear
save_like(src, "data/oakham_ink_only.tif", [np.zeros_like(grey), ink_alpha], ["Gray", "Alpha"])
print(f"outside the sheet: {(alpha == 0).mean():.1%}; fully transparent after the ink step: {(ink_alpha == 0).mean():.1%}")
outside the sheet: 1.6%; fully transparent after the ink step: 78.6%
Find the black, never nodata zero, use alpha
1. See where the black comes from
Warp without an alpha band and count the zeros. Two different things are 0:
plain = gdal.Warp("", "data/os_gcps.vrt", format="MEM", dstSRS="EPSG:27700", polynomialOrder=1, xRes=1, yRes=1)
g = plain.ReadAsArray()
print(f"zero pixels: {(g == 0).mean():.2%} of the raster, of which "
      f"{((g == 0) & (alpha == 0)).sum() / (g == 0).sum():.0%} outside the sheet and "
      f"{((g == 0) & (alpha > 0)).sum() / (g == 0).sum():.0%} black ink inside it")
zero pixels: 4.69% of the raster, of which 35% outside the sheet and 65% black ink inside it
The wedges outside the sheet and the solid ink of the map are the same number. No value-based rule can separate them afterwards.
2. Do not declare 0 as nodata on a black-and-white map
Setting nodata to 0 hides the wedges and the ink together:
nd = gdal.Translate("", plain, format="MEM", noData=0)
mask = nd.GetRasterBand(1).GetMaskBand().ReadAsArray()
inside = alpha > 0
print(f"inside the sheet, {(mask[inside] == 0).mean():.1%} of pixels are now masked - the ink")
inside the sheet, 3.1% of pixels are now masked - the ink
That is every church, building block and heavy letter on the sheet turned transparent — the figure on the GDAL georeferencing page shows the holes.
3. Use an alpha band
dstAlpha=True adds a band that is 0 only where the warp had no source pixel. It is the quick answer's first line, and the black border is gone without touching the ink. In QGIS, a raster with an alpha band is drawn transparent outside the sheet automatically.
4. Make the paper transparent when overlaying
Paper is white, and white is opaque. To see modern data through an old map, derive the alpha from the darkness of each pixel, so ink is opaque and paper clear. The quick answer's ink_alpha does that; how much of the modern layer becomes visible:
inside = alpha > 0
print(f"inside the sheet: {(ink_alpha[inside] < 32).mean():.1%} of pixels nearly clear, "
      f"{(ink_alpha[inside] > 223).mean():.1%} nearly opaque")
inside the sheet: 89.9% of pixels nearly clear, 5.9% nearly opaque
Most of the sheet is paper and becomes see-through; the linework stays. This is the same idea as a multiply blend mode, written into the file so every program shows it the same way.
5. Repair a file that was warped without alpha
If the original scan or control points are gone, the black border can still be removed: rebuild "inside the sheet" from the sheet's outline, not from pixel values. Push the scan's four corners through the same transformation, rasterise that polygon, and use it as the alpha:
gt = plain.GetGeoTransform()
corners = [t.TransformPoint(0, x, y)[1][:2] for x, y in ((0, 0), (5343, 0), (5343, 3573), (0, 3573))]
footprint = Polygon(corners)
rebuilt = features.rasterize([(footprint, 255)], out_shape=g.shape, fill=0,
                             transform=Affine.from_gdal(*gt), dtype="uint8")
agree = (rebuilt == alpha).mean()
save_like(plain, "data/oakham_repaired.tif", [g, rebuilt], ["Gray", "Alpha"])
print(f"rebuilt alpha agrees with the warp's own alpha on {agree:.2%} of pixels")
rebuilt alpha agrees with the warp's own alpha on 99.99% of pixels
The disagreement is a one-pixel fringe along the sheet edge, where the warp and the rasteriser round differently. The ink inside is untouched.
Command-line fixes and an ink-only layer
The data used on this page
The Ordnance Survey six-inch sheet Rutland 009-NW (1884–1891) from Wikimedia Commons (public domain), with seven control points matched to OpenStreetMap (Geofabrik, 1 January 2026; © OpenStreetMap contributors, ODbL) in the control-point guide.
from pathlib import Path

import numpy as np
import requests
from affine import Affine
from osgeo import gdal
from rasterio import features
from shapely.geometry import Polygon

gdal.UseExceptions()
Path("data").mkdir(exist_ok=True)
UA = {"User-Agent": "spatialworkflow.io guide (https://www.spatialworkflow.io)"}
if not Path("data/os_009-NW.jpg").exists():
    Path("data/os_009-NW.jpg").write_bytes(requests.get(
        "https://upload.wikimedia.org/wikipedia/commons/a/a0/"
        "Map_of_Rutland_OS_Map_name_009-NW%2C_Ordnance_Survey%2C_1884-1891.jpg", headers=UA, timeout=300).content)
GCPS = [  # (id, pixel, line, easting, northing)
    ("oakham_church",          3141,  487, 486065.6, 308906.1),
    ("egleton_church",         4824, 2031, 487598.5, 307540.3),
    ("brooke_rd_crossing",     2956, 1159, 485892.0, 308306.8),
    ("egleton_level_crossing", 3998, 2481, 486838.1, 307119.0),
    ("stamford_rd_guide_post", 5127,  988, 487872.3, 308486.1),
    ("braunston_rd_bridleway", 1263, 1675, 484382.4, 307839.2),
    ("brooke_guide_post",      1547, 3292, 484648.2, 306376.1),
]
gdal.Translate("data/os_gcps.vrt", "data/os_009-NW.jpg", format="VRT", bandList=[1], outputSRS="EPSG:27700",
               GCPs=[gdal.GCP(e, n, 0, px, py) for _, px, py, e, n in GCPS])
t = gdal.Transformer(gdal.Open("data/os_gcps.vrt"), None, ["MAX_GCP_ORDER=1"])

def save_like(template, path, bands, interp):
    """Write `bands` (uint8 arrays) to a GeoTIFF with `template`'s georeferencing."""
    out = gdal.GetDriverByName("GTiff").Create(path, template.RasterXSize, template.RasterYSize, len(bands),
                                               gdal.GDT_Byte, ["COMPRESS=DEFLATE", "TILED=YES"])
    out.SetGeoTransform(template.GetGeoTransform())
    out.SetProjection(template.GetProjection())
    for i, (b, ci) in enumerate(zip(bands, interp), start=1):
        out.GetRasterBand(i).WriteArray(b.astype(np.uint8))
        out.GetRasterBand(i).SetColorInterpretation({"Gray": gdal.GCI_GrayIndex, "Alpha": gdal.GCI_AlphaBand}[ci])
    out = None

print(Path("data/os_009-NW.jpg").stat().st_size, "bytes")
2653911 bytes
Example 1: the same fixes from the command line
!gdalwarp -q -overwrite -t_srs EPSG:27700 -order 1 -tr 1 1 -r cubic -dstalpha -co COMPRESS=DEFLATE data/os_gcps.vrt data/cli_alpha.tif
!gdalinfo data/cli_alpha.tif | grep -E "^Band|ColorInterp"
Band 1 Block=4843x1 Type=Byte, ColorInterp=Red
Band 2 Block=4843x1 Type=Byte, ColorInterp=Alpha
-dstalpha is the whole fix for the border. For a file already warped with black corners, gdalwarp -srcnodata 0 -dstalpha would treat the ink as nodata too — the same trap as step 2 — so rebuild the alpha from the footprint instead.
Example 2: does the ink-only layer really show what is underneath?
Check by compositing over a uniform colour and measuring how much of it shows through:
ia = gdal.Open("data/oakham_ink_only.tif").ReadAsArray()[1].astype(float) / 255
under = np.full(ia.shape, 200.0)                       # any modern layer, here a flat grey
composite = ia * 0 + (1 - ia) * under                  # black ink over it
visible = (np.abs(composite - under) < 10)[alpha > 0].mean()
print(f"modern layer visible, almost unchanged, under {visible:.1%} of the sheet")
modern layer visible, almost unchanged, under 86.9% of the sheet
A raster stores a value in every cell
A raster stores a value in every cell. When a rotated sheet is warped onto a north-up grid, some cells have no source, and they still need a value. Choosing 0 is a convention — and on a scanned black-and-white map it collides with the darkest, most important pixels on the sheet. The fix is to stop using a value to mean "nothing": an alpha band, or a separate mask band, says where the data is without borrowing a number the data might use.
Transparency for overlay is a different question with the same answer. "Is this pixel on the sheet?" and "should I see through this pixel?" are both properties that can live in alpha. For a black-and-white map the second follows directly from the grey value: dark is ink and should be seen, light is paper and should not. Writing that into the alpha band makes the effect portable — a web map, QGIS and a Python plot all show the old linework over modern data without a blend mode.
The repair in step 5 works because the border is a geometric fact, not a radiometric one. The sheet's outline is known from the transformation; anything outside it is not map, whatever its value.
Colour maps, JPEG and re-warps
- Never nodata=0 on a scan with black ink. Use alpha, or a nodata value the scan does not contain.
- Colour maps have black ink too; the same trap applies to the black band of an RGB scan.
- JPEG compression turns paper slightly grey; set a threshold, or the ink alpha leaves a faint veil.
- QGIS honours alpha bands; some web tools need PNG or WebP tiles to keep transparency.
-srcnodata 0on a re-warp reintroduces the problem; rebuild the mask from the footprint.- The one-pixel fringe at the sheet edge can be trimmed by shrinking the footprint by a pixel.
Internal links
- How to georeference a scanned map with GDAL — alpha from the start
- How to overlay a georeferenced old map on a web map — transparency in tiles
- Georeferenced map lands in the wrong place — the other common surprise
- How to mosaic historical map sheets — alpha at the seams
- Georeferencing explained — why warping leaves empty corners
FAQ
How do I remove the black border from a georeferenced map?
Warp with an alpha band (dstAlpha=True in Python, -dstalpha on the command line). The border becomes transparent and the map's black ink is untouched.
Why did setting nodata to 0 make parts of my map disappear?
On a scanned black-and-white map, ink is 0 too. Declaring 0 as nodata hides the ink along with the border.
How do I see other layers through a scanned map?
Set the alpha from the darkness of each pixel — alpha = min(alpha, 255 - grey) — so paper is transparent and ink opaque, or use a multiply blend mode in the viewer.
Can I fix a file that was already warped with black corners?
Yes: rebuild the alpha band from the sheet's footprint polygon (its corners through the transformation), rasterised onto the file's grid.