
Old Map Is Offset from Modern Data
On this page
Problem statement
The old map is georeferenced and the modern data is on top, and they do not quite agree: the railway on the old sheet runs a few metres beside today's, a road sits off by twenty metres, or everything is shifted the same way by a hundred. Some of that is the old survey, some is your georeferencing, some is a datum or CRS slip, and some is real change on the ground — and the remedy for each is different. Moving the old map until the lines meet would hide all four.
This page measures the offset along a feature that has not moved since the 1880s — the Midland Railway through Oakham, opened in 1848 — on the Ordnance Survey six-inch sheet of 1884–1891, and shows how the pattern of the offsets, not their size, tells the causes apart.
Quick answer
Measure the offset of the old map's linework from the modern line at many places along a feature that has not changed, then look at the pattern. A systematic shift is a datum or georeferencing problem; small scattered offsets are the map's own error; isolated large ones are change or mismatched features:
true_shift = np.array(from_4277.transform(*to_ll.transform(486065.6, 308906.1))) - (486065.6, 308906.1)
for label, path in (("control points labelled WGS 84 (right)", "data/oakham_right.tif"),
                    ("same points labelled OSGB 1936", "data/oakham_mislabelled.tif")):
    r = rail_offsets(path)
    q25, med, q75 = np.percentile(r["offset"], [25, 50, 75])
    predicted = r[["nx", "ny"]].to_numpy() @ true_shift            # the mislabel's shift, seen across the line
    match = (np.abs(r["offset"] - predicted) <= 15).mean()
    print(f"{label:40} median {med:+5.1f} m, middle half {q25:+6.1f} to {q75:+6.1f} m; "
          f"within 15 m of the mislabel's predicted offset: {match:.0%}")
control points labelled WGS 84 (right) median -4.5 m, middle half -10.0 to +6.0 m; within 15 m of the mislabel's predicted offset: 0%
same points labelled OSGB 1936 median -2.5 m, middle half -61.8 to +60.2 m; within 15 m of the mislabel's predicted offset: 70%
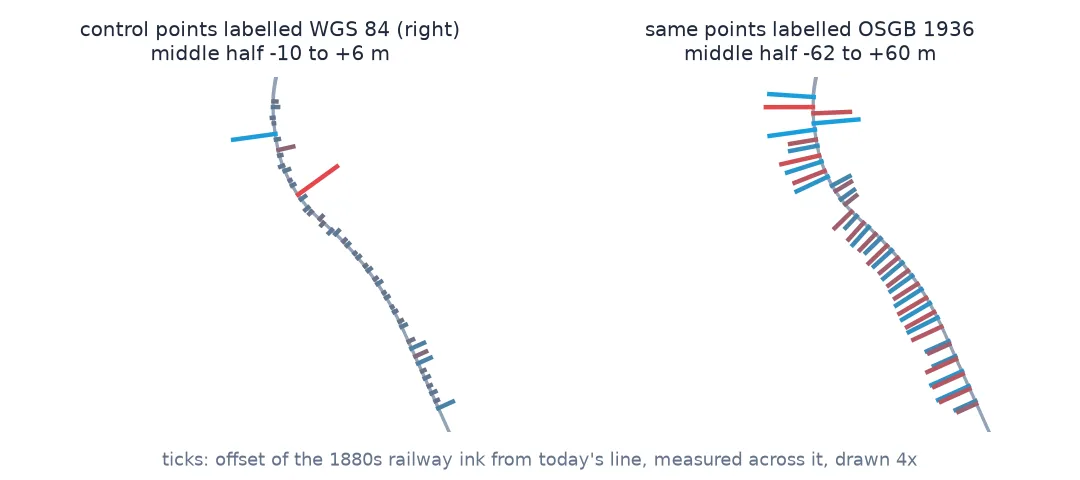
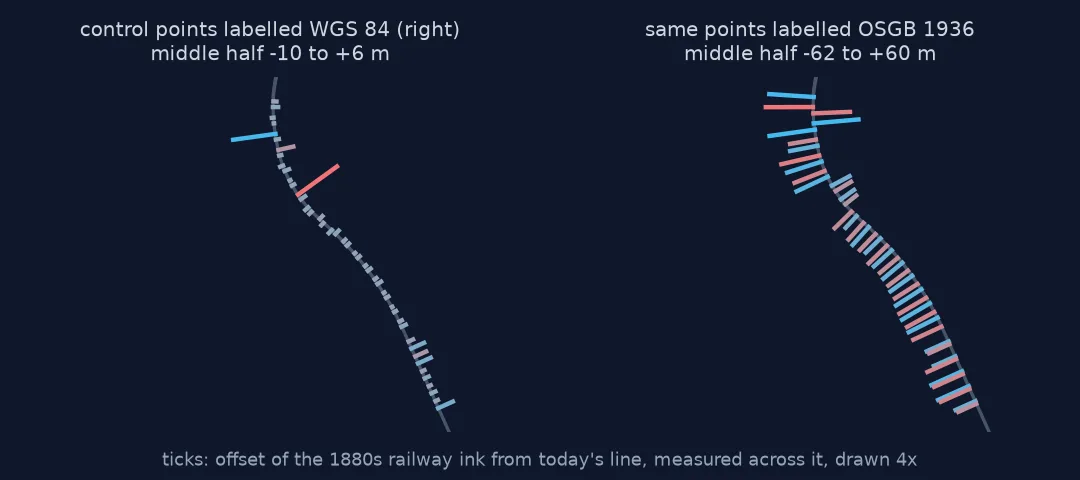
An unchanged feature, offsets across lines, the pattern
1. Choose a feature that has not changed
The comparison only works on something that is the same on the ground at both dates. Railways are the best candidate on most Victorian maps: engineered, surveyed carefully, and rarely moved. Roads are worse — widened, straightened, bypassed — and field boundaries worse still:
rail = gpd.read_file("/vsizip/data/rutland.shp.zip/gis_osm_railways_free_1.shp", bbox=BBOX).to_crs(27700)
rail = rail[rail.fclass == "rail"]
print(len(rail), "OSM railway ways,", round(rail.length.sum() / 1000, 1), "km in the sheet's area")
5 OSM railway ways, 11.9 km in the sheet's area
2. Measure the offset across the line, not along it
Along a straight railway, sliding the old map forwards or backwards changes nothing, so an offset along the line cannot be measured. Across it can: for each 150 m piece of today's line, slide it sideways over the old map and find where it covers the most ink:
r = rail_offsets("data/oakham_right.tif")
print(r[["x", "y", "offset", "ink_share"]].head(6).round(1).to_string(index=False))
x y offset ink_share
486921.2 306942.9 28 0.9
486982.8 306806.1 27 0.9
487044.3 306669.3 6 1.0
487105.8 306532.5 6 1.0
487167.3 306395.7 6 0.9
487191.5 306330.7 -37 1.0
ink_share is the fraction of the shifted line lying on ink at the best offset; low values mean the old map has no clear railway there — a station yard, a bridge, a label.
3. Read the pattern
The quick answer's two runs show two patterns. With the control points labelled correctly, the offsets centre within a few metres of zero and the middle half spans about sixteen metres — the six-inch survey's own error plus the georeferencing's, the same size as the leave-one-out error.
With the datum mislabelled, the spread explodes to more than a hundred metres, and it splits in two. Seven in ten places measure, to within 15 m, what a 115 m shift of the whole map predicts across the line at that point — the matcher found the railway, displaced. Most of the rest lock onto some other line within the search range, because the real railway is now further away than a parallel road or hedge. A spread several times the map's known accuracy is the signal: something has been applied to the whole map — a datum, a wrong CRS, a misread grid — and the cause should be found rather than the offsets interpreted.
4. Look at the outliers
A handful of places sit far from the rest:
out = r[np.abs(r["offset"] - r["offset"].median()) > 25]
print(out[["x", "y", "offset", "ink_share"]].round(1).to_string(index=False))
x y offset ink_share
486921.2 306942.9 28 0.9
486982.8 306806.1 27 0.9
487191.5 306330.7 -37 1.0
486945.5 306878.0 -32 0.9
485726.6 308699.2 35 0.8
485906.8 308289.9 110 0.7
These are not evidence that the map is wrong there. Near Oakham station the 1880s sheet draws sidings and goods lines beside the main line, and the best match locks onto those; elsewhere a parallel road or hedge offers a stronger ink line within the search range. An isolated large offset needs a look at the scan before it is called anything.
5. Decide what to do
A systematic shift means fix the cause — the datum, the CRS, the control points — and re-warp; never nudge the map by hand to fit. Scattered offsets mean quote them as the map's accuracy and do not interpret differences smaller than about twice their spread. Isolated large offsets mean look, and if the ground changed, report it as change.
Railways and roads as evidence
The data used on this page
The Ordnance Survey six-inch sheet Rutland 009-NW (1884–1891) from Wikimedia Commons (public domain), with seven control points matched to OpenStreetMap (Geofabrik, 1 January 2026; © OpenStreetMap contributors, ODbL) in the control-point guide.
from pathlib import Path

import geopandas as gpd
import numpy as np
import pandas as pd
import rasterio
import requests
from osgeo import gdal
from pyproj import Transformer
from rasterio import features
from rasterio.windows import from_bounds
from shapely import affinity
from shapely.geometry import LineString, box

gdal.UseExceptions()
Path("data").mkdir(exist_ok=True)
UA = {"User-Agent": "spatialworkflow.io guide (https://www.spatialworkflow.io)"}
downloads = {
    "data/os_009-NW.jpg": "https://upload.wikimedia.org/wikipedia/commons/a/a0/"
                          "Map_of_Rutland_OS_Map_name_009-NW%2C_Ordnance_Survey%2C_1884-1891.jpg",
    "data/rutland.shp.zip": "https://download.geofabrik.de/europe/united-kingdom/england/rutland-260101-free.shp.zip",
}
for target, url in downloads.items():
    if not Path(target).exists():
        Path(target).write_bytes(requests.get(url, headers=UA, timeout=300).content)
GCPS = [  # (id, pixel, line, easting, northing)
    ("oakham_church",          3141,  487, 486065.6, 308906.1),
    ("egleton_church",         4824, 2031, 487598.5, 307540.3),
    ("brooke_rd_crossing",     2956, 1159, 485892.0, 308306.8),
    ("egleton_level_crossing", 3998, 2481, 486838.1, 307119.0),
    ("stamford_rd_guide_post", 5127,  988, 487872.3, 308486.1),
    ("braunston_rd_bridleway", 1263, 1675, 484382.4, 307839.2),
    ("brooke_guide_post",      1547, 3292, 484648.2, 306376.1),
]
BBOX = (-0.7722, 52.6454, -0.6986, 52.6757)
to_ll = Transformer.from_crs(27700, 4326, always_xy=True)
from_4277 = Transformer.from_crs(4277, 27700, always_xy=True)          # OSGB 1936 longitude/latitude
for path, srs in (("data/oakham_right.tif", "EPSG:4326"), ("data/oakham_mislabelled.tif", "EPSG:4277")):
    if not Path(path).exists():
        v = gdal.Translate("", "data/os_009-NW.jpg", format="VRT", bandList=[1], outputSRS=srs,
                           GCPs=[gdal.GCP(*to_ll.transform(e, n), 0, px, py) for _, px, py, e, n in GCPS])
        gdal.Warp(path, v, dstSRS="EPSG:27700", polynomialOrder=1, xRes=1, yRes=1, resampleAlg="cubic",
                  dstAlpha=True, creationOptions=["COMPRESS=DEFLATE", "TILED=YES"])

def rail_offsets(path, step=150, half=75, search=150):
    """Cross-track offset (m) of the old map's ink from OSM's railway, every `step` m along it."""
    rail = gpd.read_file("/vsizip/data/rutland.shp.zip/gis_osm_railways_free_1.shp", bbox=BBOX).to_crs(27700)
    rows = []
    with rasterio.open(path) as src:
        lines = rail[rail.fclass == "rail"].union_all().intersection(box(*src.bounds).buffer(-150))
        for L in getattr(lines, "geoms", [lines]):
            for d in np.arange(half, L.length - half, step):
                p, q = L.interpolate(d), L.interpolate(d + 1)
                t = np.array([q.x - p.x, q.y - p.y]) / np.hypot(q.x - p.x, q.y - p.y)
                nrm = np.array([-t[1], t[0]])
                seg = LineString([L.interpolate(d - half).coords[0], L.interpolate(d + half).coords[0]])
                x0, y0, x1, y1 = seg.buffer(search + 5).bounds
                win = from_bounds(x0, y0, x1, y1, src.transform).round_offsets().round_lengths()
                g, a = src.read(1, window=win), src.read(2, window=win)
                ink = (g < 128) & (a > 0)
                wt = src.window_transform(win)
                share = [ink[features.rasterize([(affinity.translate(seg, *(nrm * s)).buffer(1.5), 1)],
                                                 out_shape=ink.shape, transform=wt, dtype="uint8").astype(bool)].mean()
                         for s in range(-search, search + 1)]
                rows.append({"x": p.x, "y": p.y, "nx": nrm[0], "ny": nrm[1],
                             "offset": int(np.argmax(share)) - search, "ink_share": max(share)})
    return pd.DataFrame(rows)

print({p.name: round(p.stat().st_size / 1e6, 1) for p in Path("data").glob("oakham_*.tif")})
{'oakham_mislabelled.tif': 4.5, 'oakham_right.tif': 4.5}
Example 1: the size of the shift, from the offsets alone
Each cross-track offset is the shift vector projected onto that place's normal. A least-squares fit of one vector to all of them, refitted twice without the places more than 25 m from the model (the sidings), estimates the shift:
for label, path in (("right", "data/oakham_right.tif"), ("mislabelled", "data/oakham_mislabelled.tif")):
    r = rail_offsets(path)
    N, o = r[["nx", "ny"]].to_numpy(), r["offset"].to_numpy(float)
    keep = np.ones(len(r), bool)
    for _ in range(3):
        shift, *_ = np.linalg.lstsq(N[keep], o[keep], rcond=None)
        keep = np.abs(o - N @ shift) < 25
    print(f"{label:12} fitted shift {np.hypot(*shift):5.1f} m towards bearing {np.degrees(np.arctan2(*shift)) % 360:5.1f} deg "
          f"from {keep.sum()} places")

true = np.array(from_4277.transform(*to_ll.transform(486065.6, 308906.1))) - (486065.6, 308906.1)
print(f"the mislabel's true shift: {np.hypot(*true):.0f} m towards bearing {np.degrees(np.arctan2(*true)) % 360:.0f} deg")
right fitted shift 9.7 m towards bearing 110.3 deg from 40 places
mislabelled fitted shift 74.2 m towards bearing 270.1 deg from 35 places
the mislabel's true shift: 115 m towards bearing 290 deg
The direction comes out right — westward — but the size is underestimated, because the railway's two branches on this sheet run within about sixty degrees of each other and the shift is close to parallel to one of them. A railway gives a good diagnosis and a rough measurement; for the exact shift, use features running in several directions, or fix the cause and re-warp.
Example 2: roads, for comparison
The same measurement along today's main roads shows why roads make poor reference features:
roads = gpd.read_file("/vsizip/data/rutland.shp.zip/gis_osm_roads_free_1.shp", bbox=BBOX).to_crs(27700)
main = roads[roads.fclass.isin(["trunk", "primary", "secondary"])]
print(main.assign(m=main.length).groupby("name")["m"].sum().sort_values(ascending=False).head(5).round().to_string())
name
Stamford Road 4696.0
Uppingham Road 2738.0
Burley Park Way 2131.0
Burley Road 950.0
Mount Pleasant 746.0
The list includes Burley Park Way, the A606, which crosses fields where the 1880s sheet has no road at all (see ground control points explained). Any offset measured along it would be an artefact of matching to whatever the old map has nearby. A reference feature has to have existed, unchanged, at both dates.
What an offset can mean
An offset between an old map and modern data is a sum of four things: the old survey's error, the georeferencing's error, any error applied to the whole map (a datum, a CRS, a grid misread), and real change. The first two are local and scattered; the third is the same everywhere; the fourth is wherever the ground changed. Measured at one place, they are indistinguishable. Measured at many places along something that did not change, they separate by their pattern.
That is why the measurement uses a long, unchanged feature rather than a few points. The distribution of offsets carries the diagnosis: its centre says whether there is a systematic shift, its spread says how accurate the map is, and its outliers say where to look. On the Oakham sheet the correct georeferencing centres the railway on today's within a few metres; the same control points with a datum mislabel scatter the offsets over more than a hundred metres, seven in ten of them measuring the 115 m shift.
The remedy follows from the diagnosis. A shift is corrected at its cause. Scatter is reported, not removed — any attempt to remove it by bending the map is fitting noise. And only offsets clearly outside the scatter, at places where the scan confirms a difference, are evidence of change.
Sidings, parallel lines and one direction
- Measure across a line, not along it; along-track offsets on a straight feature are undefined.
- Railways first, then old roads in villages; never modern roads or bypasses.
- Sidings and parallel lines attract the match; drop outliers or check them on the scan.
- One shift vector needs lines in more than one direction to be well determined.
- Never nudge the old map by hand to make lines meet; fix the cause or report the scatter.
- Change is what is left after the systematic and scattered parts are accounted for.
Internal links
- Georeferenced map lands in the wrong place — when the shift is large
- Low GCP residuals, but the map is still wrong — shared errors and residuals
- How accurate is a historical map? — the scatter as accuracy
- How to measure change from an old map — what is left is change
- Ground control points explained — features that have not moved
FAQ
Why is my old map offset from modern data?
Some combination of the old survey's error, georeferencing error, a datum or CRS mistake, and real change on the ground. Measure the offset at many places along an unchanged feature to tell them apart.
How do I tell a datum error from map error?
A datum error shifts every place in the same direction; map error scatters around zero. The median of many cross-track offsets shows the first, their spread the second.
Should I shift the old map to line up with modern data?
Only if the offset is systematic and you have found and fixed its cause. Shifting a map to remove scattered offsets hides its real accuracy.
What is a good feature for checking alignment?
One that existed at both dates and has not moved: a railway, a canal, a church, an old village street. Not a modern road or a field boundary.