
How to Overlay a Georeferenced Old Map on a Web Map
On this page
Problem statement
A georeferenced GeoTIFF is the right file for GIS work and the wrong one for sharing. A web map cannot read a 5 MB GeoTIFF in British National Grid directly; it wants small image tiles in Web Mercator, served by zoom level, with transparency where the old sheet has no data. And once it is on the web, the useful thing is to see the old map against the modern one — fading between them with a slider — which means the modern layer has to be there too.
This page takes the Ordnance Survey six-inch sheet of Oakham (1884–1891), georeferenced with seven control points, and turns it into an XYZ tile pyramid, a MapLibre page with today's OpenStreetMap roads on top and an opacity slider, and a check in a real browser that the tiles load where they should.
Quick answer
Warp to Web Mercator with an alpha band, cut tiles with gdal2tiles, and point a MapLibre raster source at them:
gdal.Warp("data/oakham_3857.tif", "data/os_gcps.vrt", dstSRS="EPSG:3857", polynomialOrder=1,
          resampleAlg="cubic", dstAlpha=True, creationOptions=["COMPRESS=DEFLATE", "TILED=YES"])
gdal2tiles.main(["gdal2tiles", "--xyz", "-z", "13-17", "-r", "bilinear", "--processes", "1", "-q",
                 "data/oakham_3857.tif", "site/tiles"])
tiles = list(Path("site/tiles").rglob("*.png"))
print(len(tiles), "tiles,", round(sum(p.stat().st_size for p in tiles) / 1e6, 1), "MB;",
      {z: len(list(Path(f"site/tiles/{z}").rglob("*.png"))) for z in range(13, 18)})
714 tiles, 12.0 MB; {13: 6, 14: 15, 15: 40, 16: 140, 17: 513}
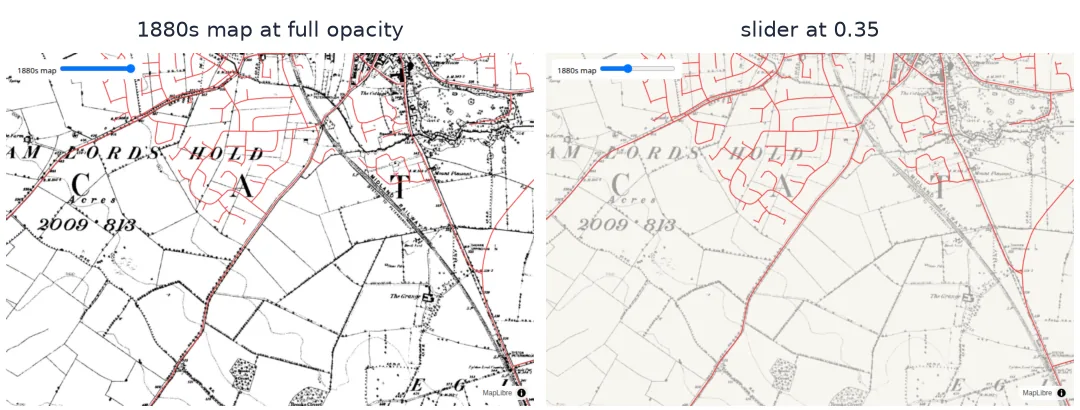
The page then needs a dozen lines of MapLibre: a raster source with tiles: ["tiles/{z}/{x}/{y}.png"], a GeoJSON source of modern roads, and a slider bound to raster-opacity. Here it is in a browser, at two settings of the slider:
Warp to Web Mercator, choose zooms, write the viewer
1. Warp to Web Mercator, not to the national grid
Web maps tile in EPSG:3857. Warping straight from the control points to Web Mercator resamples once; warping to British National Grid first and letting the tiler reproject resamples twice and blurs thin lines:
ds = gdal.Open("data/oakham_3857.tif")
gt = ds.GetGeoTransform()
print(ds.RasterXSize, "x", ds.RasterYSize, "px at", round(gt[1], 3), "m (Mercator metres);",
      ds.RasterCount, "bands:", [gdal.GetColorInterpretationName(ds.GetRasterBand(i).GetColorInterpretation())
                                 for i in range(1, ds.RasterCount + 1)])
5390 x 3625 px at 1.484 m (Mercator metres); 2 bands: ['Red', 'Alpha']
Mercator metres are not ground metres: at Oakham's latitude, 52.7° N, one Mercator metre is about 0.61 m on the ground, so the default 1.48 Mercator metres per pixel is the sheet's own 0.9 m.
2. Choose the zoom levels from the scan
Each zoom level halves the tile pixel size. The sheet's own detail stops at about 0.9 m on the ground; zooming further only enlarges pixels:
lat = 52.67
for z in range(12, 19):
    ground = 40075016.686 * np.cos(np.radians(lat)) / (256 * 2 ** z)
    print(f"zoom {z}: {ground:5.2f} m per tile pixel" + ("   <- finer than the scan" if ground < 0.9 else ""))
zoom 12: 23.18 m per tile pixel
zoom 13: 11.59 m per tile pixel
zoom 14: 5.79 m per tile pixel
zoom 15: 2.90 m per tile pixel
zoom 16: 1.45 m per tile pixel
zoom 17: 0.72 m per tile pixel <- finer than the scan
zoom 18: 0.36 m per tile pixel <- finer than the scan
Zoom 17 is the first level finer than the scan, so 13–17 covers everything from the whole sheet to full detail. Each extra level roughly quadruples the tile count.
3. Export the modern layer
The comparison needs today's roads in longitude and latitude, clipped to the sheet:
bounds = gpd.GeoSeries([box(*gpd.read_file("data/os_footprint.geojson").total_bounds)], crs=4326)
roads = gpd.read_file("/vsizip/data/rutland.shp.zip/gis_osm_roads_free_1.shp", bbox=tuple(bounds.total_bounds))
roads = roads[roads.fclass.isin(["primary", "secondary", "tertiary", "trunk", "unclassified", "residential"])]
roads[["name", "fclass", "geometry"]].to_file("site/roads.geojson")
print(len(roads), "roads,", round(Path("site/roads.geojson").stat().st_size / 1e3), "kB")
364 roads, 129 kB
4. Write the page
The page is plain HTML. MapLibre GL JS draws the tiles and the roads; an <input type="range"> changes the old map's opacity:
html = """<!doctype html><meta charset="utf-8">
<link href="https://unpkg.com/maplibre-gl@4.7.1/dist/maplibre-gl.css" rel="stylesheet">
<script src="https://unpkg.com/maplibre-gl@4.7.1/dist/maplibre-gl.js"></script>
<style>body{margin:0} #map{position:absolute;inset:0} #ui{position:absolute;top:10px;left:10px;z-index:1;
background:#fff;padding:6px 10px;border-radius:6px;font:13px system-ui}</style>
<div id="map"></div><div id="ui">1880s map <input id="op" type="range" min="0" max="1" step="0.05" value="1"></div>
<script>
const map = new maplibregl.Map({container: "map", center: [-0.735, 52.661], zoom: 14,
  style: {version: 8, sources: {}, layers: [{id: "bg", type: "background", paint: {"background-color": "#f4f1ea"}}]}});
map.on("load", () => {
  map.addSource("os1880", {type: "raster", tiles: [location.href.replace(/[^/]*$/, "") + "tiles/{z}/{x}/{y}.png"],
                           tileSize: 256, minzoom: 13, maxzoom: 17});
  map.addLayer({id: "os1880", type: "raster", source: "os1880", paint: {"raster-opacity": 1}});
  map.addSource("roads", {type: "geojson", data: "roads.geojson"});
  map.addLayer({id: "roads", type: "line", source: "roads", paint: {"line-color": "#ef4444", "line-width": 1.6}});
  document.getElementById("op").oninput = e => map.setPaintProperty("os1880", "raster-opacity", +e.target.value);
  window.ready = true;
});
</script>"""
Path("site/index.html").write_text(html)
print(len(html), "bytes of HTML")
1360 bytes of HTML
5. Check it in a real browser
A web map that "should work" often shows nothing — a tile path off by one directory, a TMS/XYZ row flip, a CORS error. Serve the folder, load it in headless Chromium, and count what the browser actually fetched:
server = ThreadingHTTPServer(("127.0.0.1", 0), partial(QuietHandler, directory="site"))
threading.Thread(target=server.serve_forever, daemon=True).start()
url = f"http://127.0.0.1:{server.server_port}/index.html"
status = {}
with sync_playwright() as p:
    browser = p.chromium.launch()
    page = browser.new_page(viewport={"width": 900, "height": 600})
    page.on("response", lambda r: status.__setitem__(r.url, r.status) if "/tiles/" in r.url else None)
    page.goto(url)
    page.wait_for_function("window.ready === true", timeout=60000)
    page.wait_for_timeout(3000)
    page.screenshot(path="data/web_map_full.png")
    page.evaluate("document.getElementById('op').value = 0.35; document.getElementById('op').dispatchEvent(new Event('input'))")
    page.wait_for_timeout(1000)
    page.screenshot(path="data/web_map_faded.png")
    browser.close()
server.shutdown()
print(f"{len(status)} tile requests: " + ", ".join(f"{n} x HTTP {s}" for s, n in Counter(status.values()).items()))
12 tile requests: 12 x HTTP 200
All the tiles in view came back with status 200 — at zoom 14 MapLibre asks for level-15 tiles, because it lays 256-pixel tiles out on a 512-pixel grid; the two screenshots are the figure at the top of the page. A 404 count here means a wrong tile path or the wrong row convention.
A swipe viewer and the size of the tile set
The data used on this page
The Ordnance Survey six-inch sheet Rutland 009-NW (1884–1891) from Wikimedia Commons (public domain), with the seven control points from the control-point guide; OpenStreetMap from Geofabrik (1 January 2026; © OpenStreetMap contributors, ODbL). MapLibre GL JS 4.7.1 from unpkg.
import threading
from collections import Counter
from functools import partial
from http.server import SimpleHTTPRequestHandler, ThreadingHTTPServer
from pathlib import Path

import geopandas as gpd
import numpy as np
import requests
from osgeo import gdal
from osgeo_utils import gdal2tiles
from playwright.sync_api import sync_playwright
from shapely.geometry import box

gdal.UseExceptions()

class QuietHandler(SimpleHTTPRequestHandler):
    def log_message(self, *args):          # keep the request log out of the output
        pass

for d in ("data", "site"):
    Path(d).mkdir(exist_ok=True)
UA = {"User-Agent": "spatialworkflow.io guide (https://www.spatialworkflow.io)"}
downloads = {
    "data/os_009-NW.jpg": "https://upload.wikimedia.org/wikipedia/commons/a/a0/"
                          "Map_of_Rutland_OS_Map_name_009-NW%2C_Ordnance_Survey%2C_1884-1891.jpg",
    "data/rutland.shp.zip": "https://download.geofabrik.de/europe/united-kingdom/england/rutland-260101-free.shp.zip",
}
for target, url in downloads.items():
    if not Path(target).exists():
        Path(target).write_bytes(requests.get(url, headers=UA, timeout=300).content)
GCPS = [  # (id, pixel, line, easting, northing)
    ("oakham_church",          3141,  487, 486065.6, 308906.1),
    ("egleton_church",         4824, 2031, 487598.5, 307540.3),
    ("brooke_rd_crossing",     2956, 1159, 485892.0, 308306.8),
    ("egleton_level_crossing", 3998, 2481, 486838.1, 307119.0),
    ("stamford_rd_guide_post", 5127,  988, 487872.3, 308486.1),
    ("braunston_rd_bridleway", 1263, 1675, 484382.4, 307839.2),
    ("brooke_guide_post",      1547, 3292, 484648.2, 306376.1),
]
gdal.Translate("data/os_gcps.vrt", "data/os_009-NW.jpg", format="VRT", bandList=[1], outputSRS="EPSG:27700",
               GCPs=[gdal.GCP(e, n, 0, px, py) for _, px, py, e, n in GCPS])
# the sheet's footprint in longitude/latitude, for clipping the modern layer
t = gdal.Transformer(gdal.Open("data/os_gcps.vrt"), None, ["MAX_GCP_ORDER=1"])
corners = [t.TransformPoint(0, x, y)[1][:2] for x, y in ((0, 0), (5343, 0), (5343, 3573), (0, 3573))]
gpd.GeoSeries([box(*np.r_[np.min(corners, 0), np.max(corners, 0)])], crs=27700).to_crs(4326).to_file("data/os_footprint.geojson")
print(gpd.read_file("data/os_footprint.geojson").total_bounds.round(4))
[-0.7713 52.6456 -0.6989 52.6757]
Example 1: a swipe instead of a fade
Some comparisons read better with a vertical divide — old map to the left, modern to the right. MapLibre does it with one raster layer clipped by CSS, but a simpler trick for a static check is two screenshots stitched at the middle:
from PIL import Image

full, faded = Image.open("data/web_map_full.png"), Image.open("data/web_map_faded.png")
w, h = full.size
swipe = full.copy()
swipe.paste(faded.crop((w // 2, 0, w, h)), (w // 2, 0))
swipe.save("data/web_map_swipe.png")
diff = np.abs(np.asarray(full, float) - np.asarray(faded, float)).mean()
print(f"{w} x {h} screenshot; mean difference between full and faded: {diff:.1f} grey levels")
900 x 600 screenshot; mean difference between full and faded: 18.2 grey levels
The difference is the proof that the slider does something: a slider wired to the wrong layer id changes nothing and produces two identical screenshots.
Example 2: how big does the tile set get?
Tile count grows by about four per zoom level, and the high zooms dominate:
for z in range(13, 18):
    files = list(Path(f"site/tiles/{z}").rglob("*.png"))
    print(f"zoom {z}: {len(files):4} tiles, {sum(f.stat().st_size for f in files) / 1e6:5.2f} MB")
zoom 13: 6 tiles, 0.08 MB
zoom 14: 15 tiles, 0.25 MB
zoom 15: 40 tiles, 0.78 MB
zoom 16: 140 tiles, 2.49 MB
zoom 17: 513 tiles, 8.35 MB
Zoom 17 is most of the total. If size matters more than the last bit of detail, stop at 16 and let MapLibre over-zoom: the maxzoom on the source tells it to stretch level-16 tiles instead of requesting tiles that do not exist.
Three pieces make an old map work on the web
Three pieces make an old map work on the web, and each corresponds to a problem the GeoTIFF does not solve.
Projection. Web maps are drawn in Web Mercator. A GeoTIFF in a national grid must be reprojected somewhere, and doing it in the warp from the control points keeps it to one resampling. Mercator's scale grows with latitude — at 52.7° N a Mercator metre is about 0.6 m on the ground — so zoom levels are chosen by ground resolution, not by the numbers in the file.
Tiling. A browser fetches only the 256-pixel tiles in view, at the zoom in use. gdal2tiles writes the pyramid; --xyz gives the row numbering MapLibre and Leaflet expect (the default TMS numbering counts rows from the south and needs scheme: "tms" in the source). Transparency comes from the alpha band: outside the sheet, tiles are transparent, not black.
Comparison. The old map is useful against the new one, and the slider is the simplest honest interface — the reader sees both, at a ratio they choose. Modern roads drawn as vectors on top stay sharp at every zoom and, unlike a second raster basemap, carry no tile-usage terms to worry about.
Checking in a real browser is the step most often skipped. Tile paths, row conventions and opacity wiring all fail silently: the page loads, the map is blank or unchanged, and nothing reports an error. Counting HTTP statuses and diffing two screenshots turns "it should work" into a measurement.
XYZ or TMS, black corners and over-zooming
- XYZ or TMS.
gdal2tilesdefaults to TMS; pass--xyzor setscheme: "tms"in the source. - Black corners mean the warp had no alpha band; see georeferenced map has a black border.
- Over-zooming past
maxzoomis free; requesting tiles you did not make produces 404s. - Mercator metres are not ground metres; choose zooms by ground resolution.
- A raster basemap from a public tile server comes with usage policies; vector layers you export yourself do not.
- File URLs do not work for tile requests in most browsers; serve the folder over HTTP even locally.
Internal links
- How to georeference a scanned map with GDAL — the warp this starts from
- Georeferenced map has a black border or hides other layers — transparency problems
- How to mosaic historical map sheets — several sheets in one tile set
- Georeferencing explained — the whole process
- How to download scanned historical maps — where the sheet came from
FAQ
How do I put a georeferenced map on a web map?
Warp it to EPSG:3857 with an alpha band, cut XYZ tiles with gdal2tiles --xyz, and add them to MapLibre or Leaflet as a raster tile layer at tiles/{z}/{x}/{y}.png.
What zoom levels should I make for an old map?
Up to the first zoom whose ground resolution is finer than the scan's; for a six-inch sheet at about 0.9 m that is zoom 17. Beyond it, let the library over-zoom.
Why are my tiles upside down or missing?
TMS and XYZ number rows in opposite directions. Make the tiles with --xyz, or tell the library the source is TMS.
How do I add an opacity slider?
Bind an <input type="range"> to map.setPaintProperty(layerId, "raster-opacity", value) in MapLibre, or layer.setOpacity(value) in Leaflet.