
How to Map German Federal Election Results in Python
On this page
Problem statement
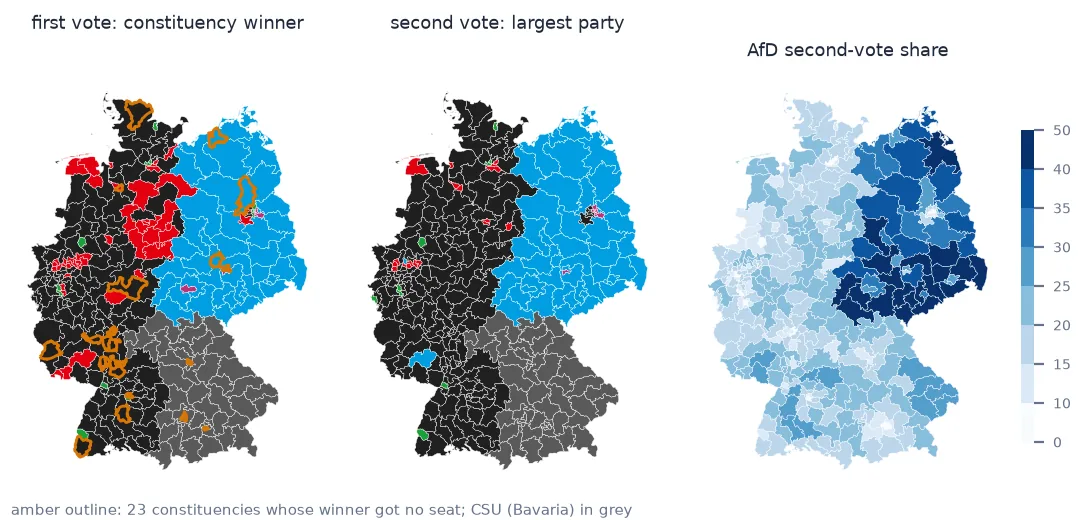
A German Bundestag election produces two results for every constituency. The first vote (Erststimme) elects a constituency member. The second vote (Zweitstimme) decides how many seats each party gets nationally. Mapping it means choosing which vote to show, reading a results file with German number formats in a long, nested layout, and joining it to the 299 constituencies. Since the 2023 electoral reform, there is a third thing to map: constituency winners who did not get a seat, because their party's second-vote result did not cover them.
This page reads the official results of the federal election of 23 February 2025 from the Federal Returning Officer (Bundeswahlleiterin). It joins them to the official constituency geometry and maps the first-vote winners, the second-vote leaders and the AfD vote. It also finds the constituencies left without a directly elected member.
Quick answer
Read the long-format CSV with ; separators and decimal commas, keep constituency rows, and pivot to one row per constituency and party:
d = pd.read_csv("data/kerg2.csv", sep=";", skiprows=9, dtype=str)
d["votes"] = pd.to_numeric(d.Anzahl, errors="coerce")
d["share"] = pd.to_numeric(d.Prozent.str.replace(",", "."), errors="coerce")       # German decimal comma
wk = d[(d.Gebietsart == "Wahlkreis") & (d.Gruppenart != "System-Gruppe")].assign(WKR_NR=lambda x: x.Gebietsnummer.astype(int))
second = wk[wk.Stimme == "2"].pivot_table(index="WKR_NR", columns="Gruppenname", values="share")
gdf = geo.join(second[["CDU", "CSU", "AfD", "SPD", "GRÜNE", "Die Linke"]], on="WKR_NR")
print(f"{len(gdf)} constituencies joined, {gdf.AfD.isna().sum()} without results; AfD share {gdf.AfD.min():.1f}–{gdf.AfD.max():.1f}%")
299 constituencies joined, 0 without results; AfD share 6.3–46.7%
The file layout, first and second votes, winners
1. Understand the file layout
kerg2.csv has a nine-line preamble, then one row per area, group and vote. The area types are federal, state and constituency; the groups are parties, independents and system groups (electorate, turnout, invalid votes):
print(d.Gebietsart.value_counts().to_dict())
print(d.Gruppenart.value_counts().to_dict())
fed = d[(d.Gebietsart == "Bund") & (d.Stimme == "2") & (d.Gruppenart == "Partei")].nlargest(8, "votes")
print(fed[["Gruppenname", "votes", "share"]].round(2).to_string(index=False))
{'Wahlkreis': 14776, 'Land': 774, 'Bund': 67}
{'Partei': 12950, 'System-Gruppe': 2528, 'Einzelbewerber/Wählergruppe': 139}
Gruppenname votes share
CDU 11196374.0 22.55
AfD 10328780.0 20.80
SPD 8149124.0 16.41
GRÜNE 5762380.0 11.61
Die Linke 4356532.0 8.77
CSU 2964028.0 5.97
BSW 2472947.0 4.98
FDP 2148757.0 4.33
Read the numbers as text first. Anzahl uses no thousands separator, but Prozent uses a decimal comma, and pandas would otherwise read 22,550824 as text or the wrong number.
2. First vote and second vote are different maps
first = wk[wk.Stimme == "1"].loc[lambda x: x.groupby("WKR_NR").votes.idxmax()].set_index("WKR_NR")
lead2 = wk[wk.Stimme == "2"].loc[lambda x: x.groupby("WKR_NR").votes.idxmax()].set_index("WKR_NR")
print("first-vote winners:", first.Gruppenname.value_counts().to_dict())
print("second-vote leaders:", lead2.Gruppenname.value_counts().to_dict())
split = (first.Gruppenname != lead2.Gruppenname)
print(f"constituencies where they differ: {split.sum()}; most common:",
      pd.Series(list(zip(first.Gruppenname[split], lead2.Gruppenname[split]))).value_counts().head(3).to_dict())
first-vote winners: {'CDU': 143, 'CSU': 47, 'AfD': 46, 'SPD': 45, 'GRÜNE': 12, 'Die Linke': 6}
second-vote leaders: {'CDU': 170, 'AfD': 49, 'CSU': 47, 'SPD': 17, 'GRÜNE': 9, 'Die Linke': 7}
constituencies where they differ: 34; most common: {('SPD', 'CDU'): 26, ('GRÜNE', 'Die Linke'): 2, ('GRÜNE', 'CDU'): 2}
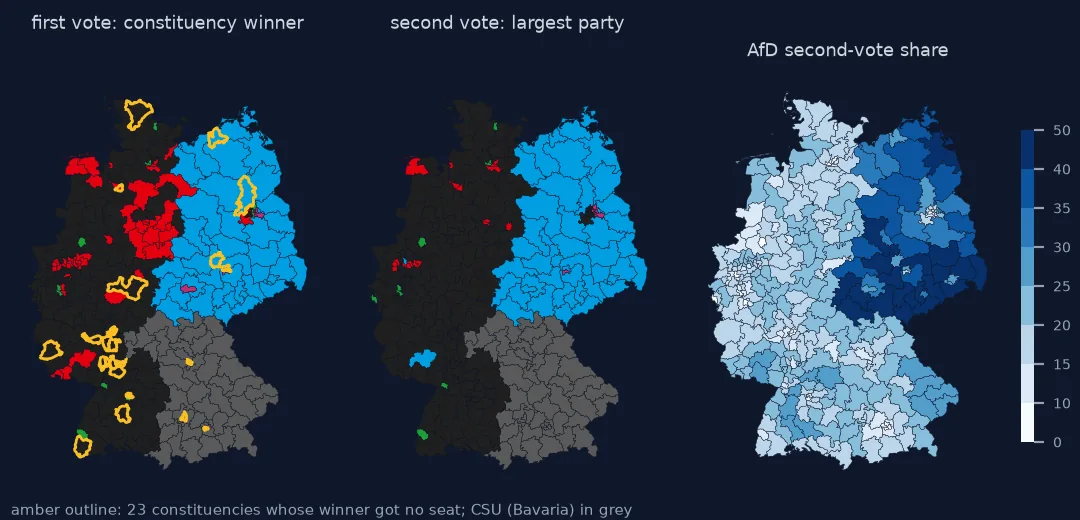
The first-vote map favours parties with strong local candidates; the second-vote map shows party support. In 2025 the two differ in 34 constituencies, 26 of them where an SPD candidate won the constituency while the CDU led the party vote.
3. Find the winners without a seat
Under the reformed electoral law, a party keeps only as many constituency seats as its second-vote share entitles it to. Winners beyond that are not elected, and the results file marks it in the Gewählt column:
lost = first[first["Gewählt"] == "–"]
print(f"{len(lost)} constituency winners not elected:", lost.Gruppenname.value_counts().to_dict())
print(lost.Gebietsname.head(6).tolist())
23 constituency winners not elected: {'CDU': 15, 'AfD': 4, 'CSU': 3, 'SPD': 1}
['Flensburg – Schleswig', 'Rostock – Landkreis Rostock II', 'Bremen I', 'Oberhavel – Havelland II', 'Halle', 'Leipzig I']
4. Map the second-vote share
gdf["east"] = gdf.LAND_NR.isin(["12", "13", "14", "15", "16"])          # the five eastern states, Berlin excluded
print(gdf.groupby("east").AfD.describe()[["count", "mean", "min", "max"]].round(1).to_string())
ax = gdf.to_crs(25832).plot(column="AfD", cmap="Blues", legend=True, figsize=(6, 8), edgecolor="white", linewidth=0.2)
ax.set_axis_off(); ax.figure.savefig("data/afd_2025.png", dpi=150)
count mean min max
east
False 251.0 18.1 6.3 31.2
True 48.0 36.6 18.5 46.7
The AfD map is a picture of the former inner-German border: the 48 constituencies of the five eastern states average 36.6% (18.5–46.7%), the 251 others 18.1%, and none outside the east passes 31.2%.
Turnout and the winner's margin
The data used on this page
Final results of the 2025 Bundestag election (kerg2.csv) and constituency geometry (btw25_geometrie_wahlkreise_shp_geo) from Die Bundeswahlleiterin, © Die Bundeswahlleiterin, Wiesbaden 2025, Datenlizenz Deutschland – Namensnennung 2.0.
from pathlib import Path

import geopandas as gpd
import matplotlib
matplotlib.use("Agg")
import numpy as np
import pandas as pd
import requests

Path("data").mkdir(exist_ok=True)
BW = "https://www.bundeswahlleiterin.de/"
SOURCES = {"kerg2.csv": BW + "bundestagswahlen/2025/ergebnisse/opendata/btw25/csv/kerg2.csv",
           "btw25_wk_geo.zip": BW + "dam/jcr/556bec9c-be80-4818-a368-fe6596f15f08/btw25_geometrie_wahlkreise_shp_geo.zip"}
for name, url in SOURCES.items():
    if not Path("data", name).exists():
        Path("data", name).write_bytes(requests.get(url, timeout=300).content)
geo = gpd.read_file("data/btw25_wk_geo.zip")
print(Path("data/kerg2.csv").read_text(encoding="utf-8-sig").splitlines()[0])
print(f"{len(geo)} constituencies, CRS {geo.crs}")
(c) Die Bundeswahlleiterin, Wiesbaden 2025;;;;;;;;;;;;;;;;
299 constituencies, CRS EPSG:4326
Example 1: turnout by constituency
sysg = d[(d.Gebietsart == "Wahlkreis") & (d.Gruppenart == "System-Gruppe")]
t = sysg.pivot_table(index="Gebietsnummer", columns="Gruppenname", values="votes", aggfunc="first")
t["turnout"] = t["Wählende"] / t["Wahlberechtigte"] * 100
print(f"turnout {t.turnout.min():.1f}–{t.turnout.max():.1f}%, median {t.turnout.median():.1f}%")
print("lowest:", d.set_index("Gebietsnummer").Gebietsname.drop_duplicates().reindex(t.turnout.nsmallest(3).index).tolist())
turnout 73.4–88.0%, median 82.9%
lowest: ['Duisburg II', 'Bremen II – Bremerhaven', 'Gelsenkirchen']
Example 2: the second-vote winner's margin
top2 = wk[wk.Stimme == "2"].sort_values("votes", ascending=False).groupby("WKR_NR").head(2)
margin = top2.groupby("WKR_NR").share.agg(lambda s: s.iloc[0] - s.iloc[1])
gdf["margin2"] = margin
print(f"closest second-vote race: {margin.min():.2f} points; widest {margin.max():.1f} points")
print(gdf.nsmallest(3, "margin2")[["WKR_NAME", "margin2"]].round(2).to_string(index=False))
closest second-vote race: 0.02 points; widest 27.2 points
WKR_NAME margin2
Helmstedt – Wolfsburg 0.02
Delmenhorst – Wesermarsch – Oldenburg-Land 0.03
Berlin-Marzahn-Hellersdorf 0.12
Constituencies and proportional representation combined
German federal elections combine constituencies and proportional representation. The first vote produces 299 local winners and the second vote the national party shares that decide the size of each parliamentary group. Before 2023, a party that won more constituencies than its second-vote share justified kept them as overhang seats, and other parties received balancing seats. The 2023 reform fixed the Bundestag at 630 seats and removed overhang. A constituency winner now enters parliament only if the party's second-vote result covers that seat.
Mapping it well means being explicit about which vote is shown. A first-vote map tells you about candidates and local strongholds. A second-vote map tells you about party support, and the national result is built from it. The 2025 innovation, constituencies without an elected winner, is invisible on both unless you map it on purpose.
CDU and CSU, decimal commas and redistricting
- CDU and CSU never compete in the same constituency: the CSU stands only in Bavaria, the CDU everywhere else.
- Decimal commas and
;separators are standard in German official CSV files; read numbers as text and convert. - Constituency boundaries are revised between elections; join results and geometry from the same election.
- The file has a preamble of nine lines with licence and status;
skiprows=9reaches the header. - Independent candidates appear as their own group type (
Einzelbewerber/Wählergruppe); keep them in first-vote totals. - Berlin is sometimes grouped with the east and sometimes not; state your choice.
Internal links
- How to make a US county election map — the same task with US data
- Election results won't join the boundaries — key problems
- Choropleth classification explained — classing the share map
FAQ
Where can I download German election results as CSV?
From the Federal Returning Officer (Bundeswahlleiterin) open data pages; kerg2.csv has every constituency, state and federal result in long format.
Should I map the first vote or the second vote?
The second vote for party support and the national outcome; the first vote for constituency winners and candidate effects. Label the map with which one it is.
Why did some German constituency winners not get a seat in 2025?
Under the 2023 reform, a party keeps only as many constituency seats as its second-vote share covers; 23 winners in 2025 were not elected.
How do I read German CSV numbers in pandas?
Use sep=";" and convert decimal commas, e.g. pd.to_numeric(s.str.replace(",", ".")), or pass decimal="," to read_csv.