
How to Make a UK Election Hex Map in Python
On this page
Problem statement
The UK's 650 parliamentary constituencies are designed to hold roughly equal numbers of voters, which makes them wildly unequal in size. The geographic results map of the 2024 general election is dominated by a few vast Highland and rural seats. The several hundred seats of London, Birmingham and Manchester shrink to specks. In a first-past-the-post election every seat counts once, so the honest picture gives every constituency the same size. That is what a hex map does: one hexagon per seat, arranged to keep neighbours roughly in place.
This page draws the 2024 result as a hex map from the House of Commons Library's official results and the Open Innovations HexJSON layout. It sets the hex map against the geographic map and measures what each one shows.
Quick answer
Read the HexJSON, convert its offset coordinates to positions, and join the winners on the ONS constituency code:
layout = json.loads(Path("data/uk-constituencies-2023.hexjson").read_text())
hexes = pd.DataFrame.from_dict(layout["hexes"], orient="index")
odd = hexes.r % 2 == 1                                                 # works for negative rows in Python
hexes["x"] = hexes.q * np.sqrt(3) + np.where(odd, np.sqrt(3) / 2, 0)  # layout "odd-r": odd rows shift right
hexes["y"] = hexes.r * 1.5
hexes = hexes.join(winners.party)
print(layout["layout"], len(hexes), "hexes;", hexes.party.isna().sum(), "without a result")
print(hexes.party.value_counts().head(8).to_dict())
odd-r 650 hexes; 0 without a result
{'Lab': 411, 'Con': 121, 'LD': 72, 'SNP': 9, 'SF': 7, 'Ind': 6, 'RUK': 5, 'DUP': 5}
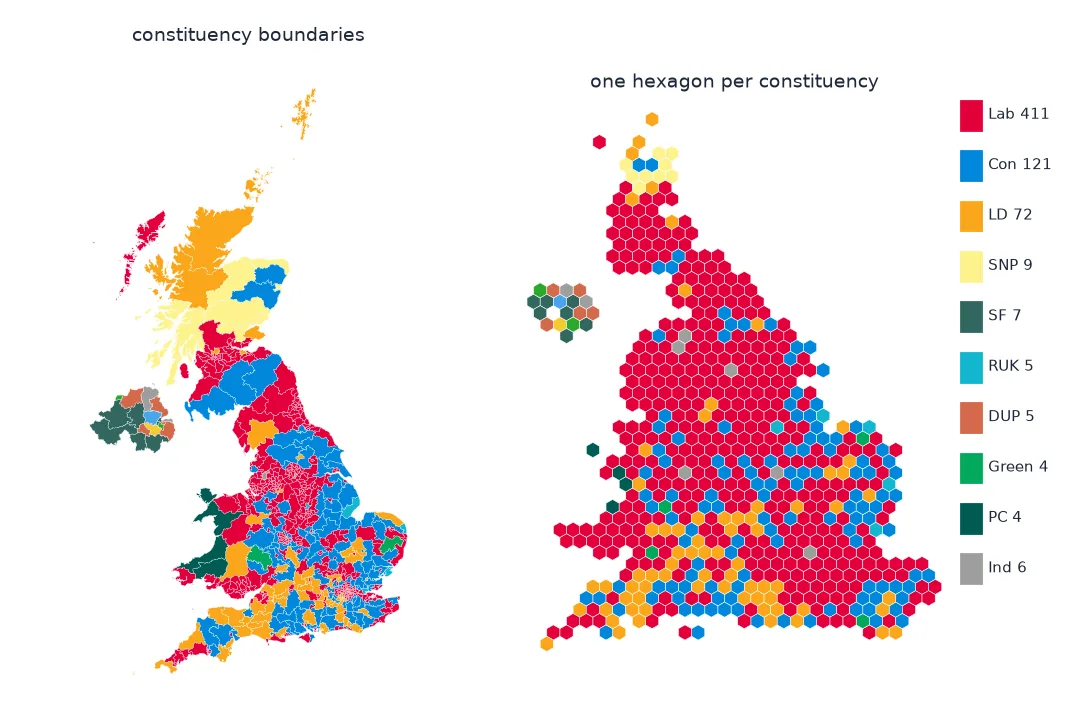
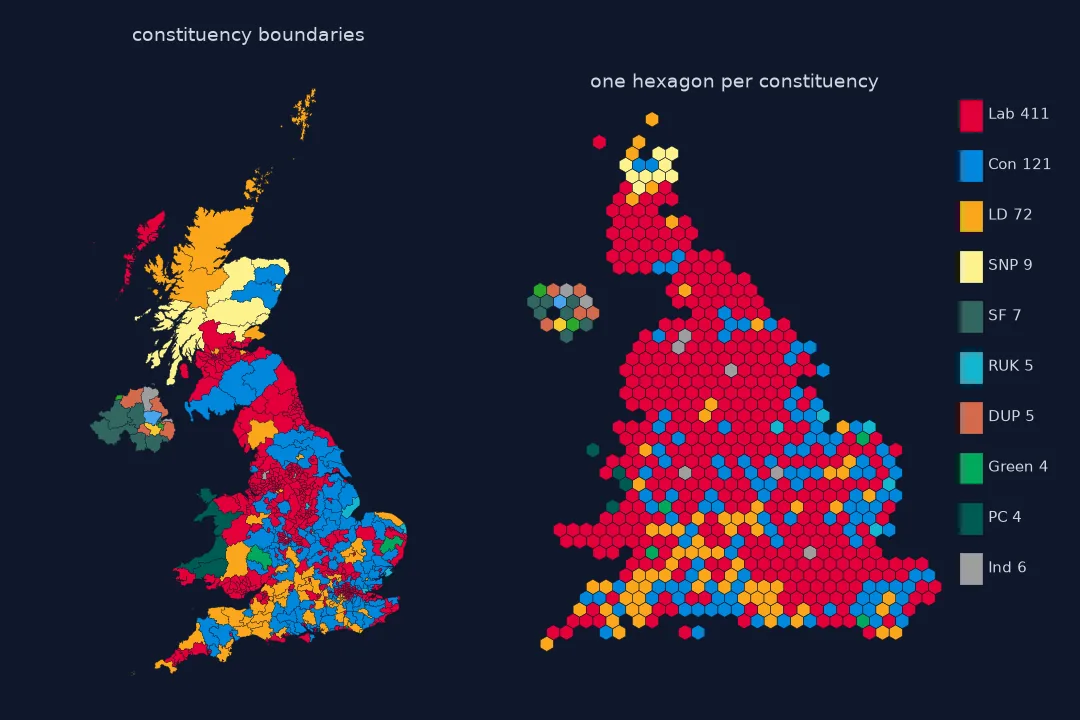
Results and winners, votes against seats, the hexagons
1. Get the results and pick the winners
The official results come as one row per candidate. The winner is the candidate in position 1; the Speaker stands without a party:
c = cand.copy()
print(f"{len(c):,} candidacies in {c['Constituency geographic code'].nunique()} constituencies; "
      f"{c['Candidate vote count'].sum():,} valid votes")
w = c[c["Candidate result position"] == 1]
print("Speaker's seat:", w[w["Candidate is standing as Commons Speaker"]]["Constituency name"].tolist())
4,515 candidacies in 650 constituencies; 28,809,340 valid votes
Speaker's seat: ['Chorley']
2. Compare votes with seats
votes = c.groupby("party")["Candidate vote count"].sum()
table = pd.DataFrame({"votes %": votes / votes.sum() * 100, "seats": winners.party.value_counts()}).fillna(0)
table["seats"] = table.seats.astype(int)
table["seats %"] = table.seats / 650 * 100
table["votes per seat"] = (votes / table.seats.replace(0, np.nan)).round(-2)
print(table.sort_values("seats", ascending=False).head(9).round(1).to_string())
votes % seats seats % votes per seat
party
Lab 33.7 411 63.2 23600.0
Con 23.7 121 18.6 56400.0
LD 12.2 72 11.1 48900.0
SNP 2.5 9 1.4 80500.0
SF 0.7 7 1.1 30100.0
Ind 2.0 6 0.9 94000.0
DUP 0.6 5 0.8 34400.0
RUK 14.3 5 0.8 823500.0
Green 6.7 4 0.6 486100.0
First past the post turns a third of the vote into almost two thirds of the seats, and leaves Reform UK, with a seventh of the vote, five seats. A hex map shows the seats, which is what decides who governs. It does not show the votes; pair it with a votes chart.
3. Draw the hexagons
HexJSON stores offset coordinates. With pointy-topped hexagons of radius 1, columns are √3 apart and rows 1.5 apart. In an odd-r layout every odd row is shifted half a column right:
fig, ax = plt.subplots(figsize=(6, 9))
ax.add_collection(PatchCollection([RegularPolygon((x, y), 6, radius=1.0) for x, y in zip(hexes.x, hexes.y)],
                                  facecolor=[COLOURS.get(p, "#9e9e9e") for p in hexes.party], edgecolor="white", linewidth=0.3))
ax.set_xlim(hexes.x.min() - 2, hexes.x.max() + 2); ax.set_ylim(hexes.y.min() - 2, hexes.y.max() + 2)
ax.set_aspect("equal"); ax.set_axis_off()
fig.savefig("data/uk_2024_hex.png", dpi=150)
d = np.hypot(*(hexes[["x", "y"]].values[:, None] - hexes[["x", "y"]].values[None]).transpose(2, 0, 1))
np.fill_diagonal(d, np.inf)
nn = d.min(axis=1)
print(f"nearest-neighbour spacing: min {nn.min():.3f} (√3 = {np.sqrt(3):.3f}); {(nn > np.sqrt(3) + 1e-6).sum()} hexes touch no other: "
      f"{hexes.n[nn > np.sqrt(3) + 1e-6].tolist()}")
nearest-neighbour spacing: min 1.732 (√3 = 1.732); 3 hexes touch no other: ['Orkney and Shetland', 'Na h-Eileanan an Iar', 'Ynys Môn']
No two hexagons are closer than √3, so nothing overlaps. The conversion is where hex maps usually go wrong, and Hex map comes out scrambled measures each mistake on this same layout.
4. Measure what each map shows
geo = bounds.join(winners.party, on="PCON24CD")
geo["km2"] = geo.area / 1e6
share = pd.DataFrame({"area of the map %": geo.groupby("party").km2.sum() / geo.km2.sum() * 100,
                      "hexes (seats) %": hexes.party.value_counts() / 650 * 100})
print(share.sort_values("hexes (seats) %", ascending=False).head(6).round(1).to_string())
big, small = geo.nlargest(1, "km2").iloc[0], geo.nsmallest(1, "km2").iloc[0]
print(f"largest seat {big.PCON24NM} ({big.km2:,.0f} km2) is {big.km2 / small.km2:,.0f} times the smallest, {small.PCON24NM} ({small.km2:.1f} km2)")
area of the map % hexes (seats) %
party
Lab 29.1 63.2
Con 29.3 18.6
LD 21.5 11.1
SNP 9.3 1.4
SF 3.3 1.1
Ind 0.1 0.9
largest seat Caithness, Sutherland and Easter Ross (11,636 km2) is 1,897 times the smallest, Bethnal Green and Stepney (6.1 km2)
The closest seats and a web export
The data used on this page
2024 general election results from the House of Commons Library election results service (Open Parliament Licence); the Open Innovations HexJSON layout for the 2024 constituencies; constituency boundaries from the ONS Open Geography Portal (July 2024, ultra-generalised), Open Government Licence.
import json
from pathlib import Path

import geopandas as gpd
import matplotlib
matplotlib.use("Agg")
import matplotlib.pyplot as plt
import numpy as np
import pandas as pd
import requests
from matplotlib.collections import PatchCollection
from matplotlib.patches import RegularPolygon

Path("data").mkdir(exist_ok=True)
ONS = ("https://services1.arcgis.com/ESMARspQHYMw9BZ9/arcgis/rest/services/"
       "Westminster_Parliamentary_Constituencies_July_2024_Boundaries_UK_BUC/FeatureServer/0/query")
SOURCES = {
    "uk2024_candidacies.csv": "https://electionresults.parliament.uk/general-elections/6/candidacies.csv",
    "uk-constituencies-2023.hexjson": "https://raw.githubusercontent.com/odileeds/hexmaps/gh-pages/maps/uk-constituencies-2023.hexjson",
    "pcon2024_buc.geojson": ONS + "?where=1%3D1&outFields=PCON24CD,PCON24NM&outSR=27700&f=geojson",
}
for name, url in SOURCES.items():
    if not Path("data", name).exists():
        Path("data", name).write_bytes(requests.get(url, timeout=300).content)
cand = pd.read_csv("data/uk2024_candidacies.csv")
cand["party"] = cand["Main party abbreviation"].fillna("Ind")
cand.loc[cand["Candidate is standing as Commons Speaker"], "party"] = "Spk"
winners = cand[cand["Candidate result position"] == 1].set_index("Constituency geographic code")
bounds = gpd.read_file("data/pcon2024_buc.geojson").set_crs(27700, allow_override=True)
COLOURS = {"Lab": "#E4003B", "Con": "#0087DC", "LD": "#FAA61A", "SNP": "#FDF38E", "RUK": "#12B6CF", "Green": "#02A95B",
           "PC": "#005B54", "SF": "#326760", "DUP": "#D46A4C"}
print(f"{len(winners)} seats, {len(bounds)} boundaries")
650 seats, 650 boundaries
Example 1: the closest seats
second = cand[cand["Candidate result position"] == 2].set_index("Constituency geographic code")
close = winners.assign(runner_up=second.party, majority=winners.Majority).nsmallest(5, "majority")
print(close[["Constituency name", "party", "runner_up", "majority"]].to_string(index=False))
Constituency name party runner_up majority
Hendon Lab Con 15.0
Poole Lab Con 18.0
Basildon and Billericay Con Lab 20.0
North West Cambridgeshire Lab Con 39.0
Central Devon Con Lab 61.0
Example 2: export for a web map
features = [{"type": "Feature", "properties": {"code": k, "name": v.n, "party": v.party},
             "geometry": {"type": "Polygon", "coordinates": [[[float(v.x + np.cos(np.radians(a))), float(v.y + np.sin(np.radians(a)))]
                                                              for a in range(30, 391, 60)]]}} for k, v in hexes.iterrows()]
Path("data/uk_2024_hex.geojson").write_text(json.dumps({"type": "FeatureCollection", "features": features}))
print(len(features), "hexagons written; coordinates are layout units, not longitude and latitude")
650 hexagons written; coordinates are layout units, not longitude and latitude
Equal area and equal shape for equal seats
A hex map is an equal-area cartogram with every region given the same area and the same shape. It works when the regions carry equal weight, as parliamentary seats do, and when readers already know the rough geography. The layout is drawn by hand or by an optimiser, and it trades exact position for adjacency. Cornwall stays in the south-west, the Highlands at the top, London is a cluster of dozens of hexes. Any one hexagon may sit a few places from where its constituency really is.
The geographic map answers "where did each party win land?" The hex map answers "how many seats, and roughly where?" In 2024 those questions have very different answers. The Liberal Democrats and the SNP won large rural seats that fill the geographic map, and Labour won hundreds of compact urban and suburban seats that the geographic map almost hides.
Boundary changes, Northern Ireland and the Speaker's seat
- Boundary changes: 2024 seats differ from 2019's; use a layout and codes for the same boundary set.
- Northern Ireland is often drawn as a detached cluster; keep it visible.
- The Speaker's seat has no party; colour it neutrally.
- Hexagon positions are not coordinates; never overlay them on a basemap.
Internal links
- Hex and tile maps explained — when equal-area tiles work
- How to make a contiguous cartogram — sizing by a value instead
- Hexbin points in Python — hexagons as bins, a different use
FAQ
What is a hex map of election results?
A map that gives every constituency one equal hexagon, arranged to approximate geography, so each seat is equally visible.
How do I read a HexJSON file in Python?
Load it with json, take the hexes dictionary, and convert each q, r pair to x, y using the file's layout (for odd-r, shift odd rows by half a column).
Why does Labour look smaller on the geographic map than on the hex map?
Labour won many small urban seats; the geographic map gives area to large rural seats won by other parties.
Where can I get UK constituency hex layouts?
Open Innovations (formerly ODI Leeds) publishes HexJSON layouts for UK constituencies and other areas.