
Hex and Tile Maps Explained: Equal Shapes for Equal Units
On this page
Problem statement
Tile maps and hex maps draw every region as the same shape at the same size: a square per US state, a hexagon per UK constituency. They have become the default for election night graphics because they solve the problem that plagues geographic maps, where Rhode Island and Delaware vanish and Montana dominates. But they make a strong claim of their own: that every unit deserves equal space. They also give up exact geography for a layout someone designed by hand. Knowing what that claim costs, and when it is true, decides whether a tile map clarifies or misleads.
This page measures both costs on real layouts: the four published US state tile grids from the geofacet project and the UK constituency hex layout from Open Innovations, using the 2024 election results for each country.
Quick answer
A tile map is right when each unit carries equal weight, and it costs adjacency. Measure how many real neighbours a layout keeps:
real = {tuple(sorted(p)) for p in zip(*np.nonzero(touch)) if p[0] != p[1]}
real = {(codes[a], codes[b]) for a, b in real}
for name, g in GRIDS.items():
    tile = {(a, b) for a in g.index for b in g.index
            if a < b and max(abs(g.row[a] - g.row[b]), abs(g.col[a] - g.col[b])) == 1}
    kept = {p for p in real if tuple(sorted(p)) in tile}
    print(f"{name}: keeps {len(kept)} of {len(real)} real neighbour pairs ({len(kept) / len(real):.0%}), "
          f"invents {len(tile - {tuple(sorted(p)) for p in real})}")
grid1: keeps 94 of 109 real neighbour pairs (86%), invents 51
grid2: keeps 95 of 109 real neighbour pairs (87%), invents 49
grid3: keeps 94 of 109 real neighbour pairs (86%), invents 49
grid7: keeps 92 of 109 real neighbour pairs (84%), invents 43
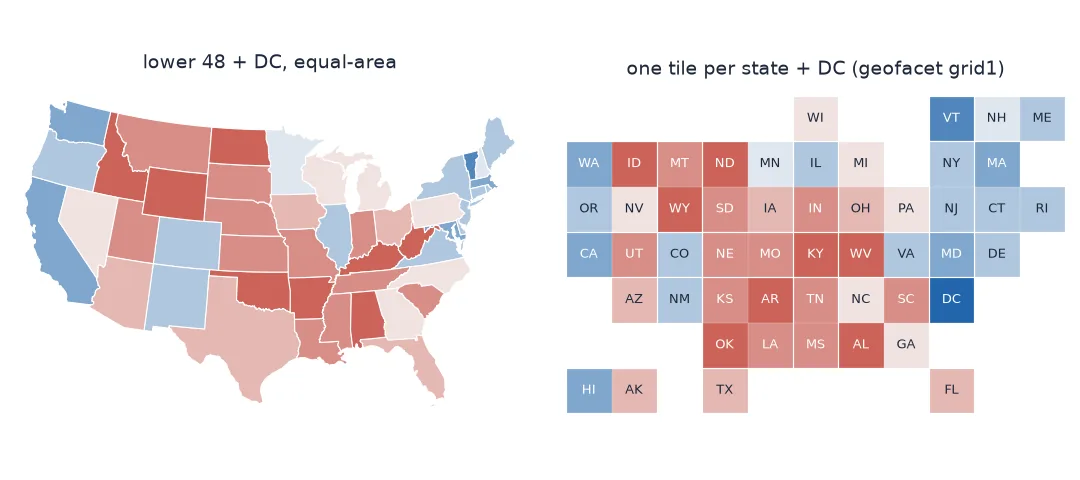
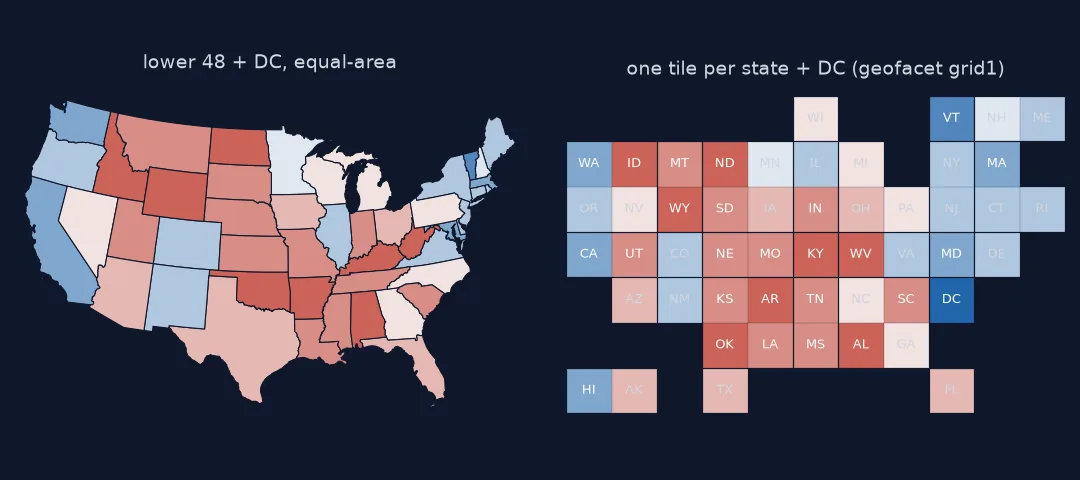
What a tile map claims, and what it costs in neighbours and position
1. What a tile map claims
Every unit gets one tile. The map is right when the units really are equal — one seat each in a parliament elected by constituencies, or one vote each in the US Senate. It is misleading when the units carry different weight, as states do in the presidential election:
won = state_results.margin > 0
ev_red = state_results.loc[won, "ev"].sum()
print(f"Republican-won states: {won.sum()} of {len(state_results)} tiles ({won.mean():.0%}), "
      f"{ev_red} of {state_results.ev.sum()} electoral votes ({ev_red / state_results.ev.sum():.0%})")
print("one tile each:", state_results.loc[["CA", "WY"], "ev"].to_dict(), "electoral votes")
Republican-won states: 31 of 51 tiles (61%), 312 of 538 electoral votes (58%)
one tile each: {'CA': 54, 'WY': 3} electoral votes
On a tile map California and Wyoming are the same square, though one has 18 times the electoral votes. In 2024 the totals happened to come out close — 61% of tiles and 58% of electoral votes were Republican — but that is a coincidence of which states went which way, not a property of the map. For the presidency, an electoral-vote cartogram or a tile map with several tiles per state is the honest version.
2. What it costs: neighbours
A square tile can touch at most eight others, and states have irregular, long borders. The quick answer counts how many of the 109 pairs of states that really touch are drawn as touching tiles, sides or corners. Every layout keeps about six in seven and invents dozens of false neighbours. That is the price of a grid, not a flaw in one design.
3. What it costs: position
cent = states_geo.geometry.centroid
for name, g in GRIDS.items():
    common = g.index.intersection(cent.index).drop(["AK", "HI"], errors="ignore")
    rank_x = np.corrcoef(g.loc[common, "col"].rank(), cent.x[common].rank())[0, 1]
    rank_y = np.corrcoef(-g.loc[common, "row"].rank(), cent.y[common].rank())[0, 1]
    print(f"{name}: west-east order kept r = {rank_x:.2f}, south-north order r = {rank_y:.2f}")
grid1: west-east order kept r = 0.99, south-north order r = 0.92
grid2: west-east order kept r = 0.99, south-north order r = 0.90
grid3: west-east order kept r = 0.99, south-north order r = 0.92
grid7: west-east order kept r = 0.99, south-north order r = 0.94
The tiles keep the west-to-east order almost perfectly (rank correlation 0.99 in every layout) and the south-to-north order a little more loosely (0.90–0.94): tall columns of states such as the Plains have to be squeezed into a handful of rows. That order is what makes the map readable.
4. Hexagons: six neighbours and a better fit
Hexagons have six edge-sharing neighbours and no corner-only contacts, so adjacency is less ambiguous than with squares. The UK hex layout puts 650 constituencies on one grid:
d = np.hypot(*(hx[["x", "y"]].values[:, None] - hx[["x", "y"]].values[None]).transpose(2, 0, 1))
np.fill_diagonal(d, np.inf)
touching = (np.abs(d - np.sqrt(3)) < 1e-6).sum(axis=1)
print(f"{len(hx)} hexes; touching neighbours per hex: median {np.median(touching):.0f}, "
      f"{(touching == 0).sum()} with none: {hx.n[touching == 0].tolist()}")
print(f"seat share = map share: Labour {(hx.party == 'Lab').mean():.1%} of the hexes")
650 hexes; touching neighbours per hex: median 6, 3 with none: ['Orkney and Shetland', 'Na h-Eileanan an Iar', 'Ynys Môn']
seat share = map share: Labour 63.2% of the hexes
Which states lose the most neighbours
The data used on this page
US state tile grids us_state_grid1, 2, 3 and 7 from the geofacet project's grid designer (MIT licence); US state boundaries from the Census Bureau cartographic boundary files, 2023; 2024 presidential results by county from tonmcg/US_County_Level_Election_Results_08-24; House seats from the Census Bureau's 2020 apportionment table; UK hex layout from Open Innovations and 2024 results from the House of Commons Library.
import json
from pathlib import Path

import geopandas as gpd
import numpy as np
import pandas as pd
import requests

Path("data").mkdir(exist_ok=True)
GD = "https://raw.githubusercontent.com/hafen/grid-designer/master/grids/"
SOURCES = {f"us_state_grid{i}.csv": f"{GD}us_state_grid{i}.csv" for i in (1, 2, 3, 7)} | {
    "cb_2023_us_state_20m.zip": "https://www2.census.gov/geo/tiger/GENZ2023/shp/cb_2023_us_state_20m.zip",
    "2024_US_County_Level_Presidential_Results.csv": "https://raw.githubusercontent.com/tonmcg/US_County_Level_Election_Results_08-24/master/2024_US_County_Level_Presidential_Results.csv",
    "apportionment-2020-table01.xlsx": "https://www2.census.gov/programs-surveys/decennial/2020/data/apportionment/apportionment-2020-table01.xlsx",
    "uk-constituencies-2023.hexjson": "https://raw.githubusercontent.com/odileeds/hexmaps/gh-pages/maps/uk-constituencies-2023.hexjson",
    "uk2024_candidacies.csv": "https://electionresults.parliament.uk/general-elections/6/candidacies.csv"}
for name, url in SOURCES.items():
    if not Path("data", name).exists():
        Path("data", name).write_bytes(requests.get(url, timeout=300).content)

GRIDS = {f"grid{i}": pd.read_csv(f"data/us_state_grid{i}.csv").set_index("code") for i in (1, 2, 3, 7)}
states_geo = gpd.read_file("data/cb_2023_us_state_20m.zip").query("STUSPS != 'PR'").to_crs(5070).set_index("STUSPS")
codes = states_geo.index.to_numpy()
touch = np.array([[a.intersects(b) for b in states_geo.geometry] for a in states_geo.geometry])

res = pd.read_csv("data/2024_US_County_Level_Presidential_Results.csv")
by_state = res.groupby("state_name")[["votes_gop", "votes_dem", "total_votes"]].sum()
seats = pd.read_excel("data/apportionment-2020-table01.xlsx", header=None).iloc[4:54, [0, 2]]
ev = dict(zip(seats[0], seats[2].astype(int) + 2)) | {"District of Columbia": 3}
state_results = GRIDS["grid1"].reset_index().set_index("name").join(by_state)
state_results["margin"] = (state_results.votes_gop - state_results.votes_dem) / state_results.total_votes
state_results["ev"] = state_results.index.map(ev)
state_results = state_results.set_index("code")

hexes = json.loads(Path("data/uk-constituencies-2023.hexjson").read_text())["hexes"]
hx = pd.DataFrame.from_dict(hexes, orient="index")
hx["x"] = hx.q * np.sqrt(3) + np.where(hx.r % 2 == 1, np.sqrt(3) / 2, 0)
hx["y"] = hx.r * 1.5
cand = pd.read_csv("data/uk2024_candidacies.csv")
hx["party"] = cand[cand["Candidate result position"] == 1].set_index("Constituency geographic code")["Main party abbreviation"]
print(f"{len(GRIDS)} US grids, {len(states_geo)} state shapes, {len(hx)} UK hexes")
4 US grids, 51 state shapes, 650 UK hexes
Example 1: which states lose the most neighbours?
g = GRIDS["grid1"]
loss = {}
for s in g.index.intersection(codes):
    i = list(codes).index(s)
    nb = {codes[j] for j in np.nonzero(touch[i])[0] if j != i}
    tiles = {t for t in g.index if t != s and max(abs(g.row[t] - g.row[s]), abs(g.col[t] - g.col[s])) == 1}
    loss[s] = (len(nb), len(nb & tiles))
worst = sorted(loss.items(), key=lambda kv: kv[1][1] - kv[1][0])[:5]
print([(s, f"{kept} of {n}") for s, (n, kept) in worst])
[('IL', '3 of 5'), ('KY', '5 of 7'), ('MO', '6 of 8'), ('OK', '4 of 6'), ('TN', '6 of 8')]
The strictest cartogram rule
A tile or hex map is a cartogram with the strictest possible rule: every unit the same size and the same shape. That removes two distractions of geographic maps, where size is land area and shape attracts attention, and leaves only colour and approximate position. Designers place the tiles to keep the most recognisable relationships. California is on the west edge, Maine in the north-east, Texas and Florida at the bottom. They then accept that many borders are broken.
Use one when the units are equal in what the map is about. Seats in a first-past-the-post parliament qualify, and so do states in the Senate or in any per-state ranking. Do not use one for quantities that differ by unit, such as population, votes cast or electoral votes, unless the tiles are scaled or multiplied. Always keep the codes or names on the tiles: readers navigate a tile map by labels, not by shapes.
Alaska, Hawaii, DC and hidden variation
- Alaska and Hawaii become ordinary tiles; that is a feature, not a bug.
- DC needs a tile; some layouts omit it.
- Hex layouts come as
odd-r,even-r,odd-qoreven-q; read the type. - Several layouts exist for the same country; pick one and keep it across a series of maps.
- Tile maps hide within-unit variation completely; pair them with a detailed map when that matters.
- Equal tiles can be scaled (multiple tiles per state for electoral votes) when units are unequal.
Internal links
- How to make a UK election hex map — the hex layout in practice
- How to make a contiguous cartogram — sizing by a value
- How to make a Dorling cartogram — circles instead of tiles
- How to make a US county election map — the geographic view
FAQ
What is a tile grid map?
A map that draws each region as one equal square (or hexagon) arranged to approximate geography.
When should I use a hex or tile map?
When each unit carries equal weight in what you are showing — for example parliamentary seats — and when readers know the geography well enough to find their unit by label.
How much geography does a tile map lose?
The published US state grids keep about 86% of real neighbour pairs and add around fifty false ones; they keep the overall west-east and north-south order.
Are hex maps better than square tile maps?
Hexagons have six unambiguous edge neighbours instead of four plus four corners, so adjacency reads more clearly; squares fit rectangular screens and text labels better.