
How to Analyse Induced Seismicity in Oklahoma with Python
On this page
Problem statement
Until 2009, Oklahoma had one or two earthquakes of magnitude 3 or more in a typical year. In 2015 it had 887, and from 2014 to 2018 it had more every year than California. The USGS and the Oklahoma Geological Survey attribute the increase to the disposal of large volumes of wastewater, produced with oil and gas, into deep formations, which raised pore pressure on faults that were close to failure. The catalogue alone shows the rise, the fall after regulators cut injection volumes from 2015, and where the activity moved, and analysing it is a lesson in comparing rates fairly and mapping change over time.
This page downloads every M3+ earthquake in Oklahoma since 1990 from the USGS catalogue, clips it to the state boundary, measures the change in annual rates, maps where the earthquakes occurred in each period, and lists the largest events.
Quick answer
Clip the catalogue to the state, count per year and compare with the background rate:
per_year = ok.groupby(ok.time.dt.year).size().reindex(range(1990, 2025), fill_value=0)
base = per_year.loc[1990:2008].mean()
print(f"M3+ in Oklahoma, 1990-2008: {base:.1f} a year; peak {per_year.max()} in {per_year.idxmax()} ({per_year.max() / base:,.0f} times the background)")
print(per_year.loc[[2008, 2009, 2010, 2012, 2014, 2015, 2016, 2017, 2018, 2020, 2022, 2024]].to_string())
M3+ in Oklahoma, 1990-2008: 1.4 a year; peak 887 in 2015 (648 times the background)
time
2008 2
2009 20
2010 41
2012 34
2014 585
2015 887
2016 639
2017 272
2018 166
2020 36
2022 15
2024 23
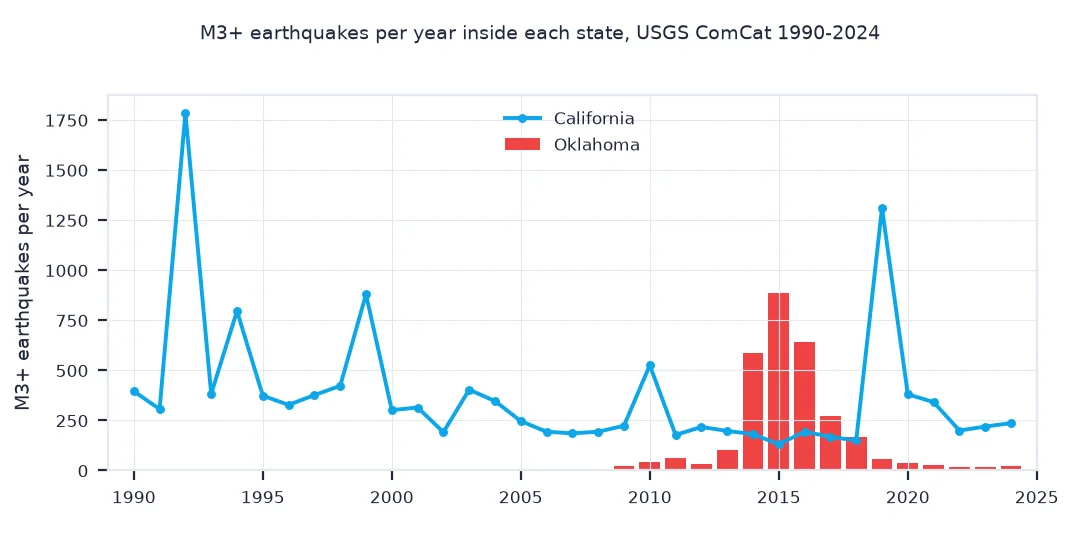
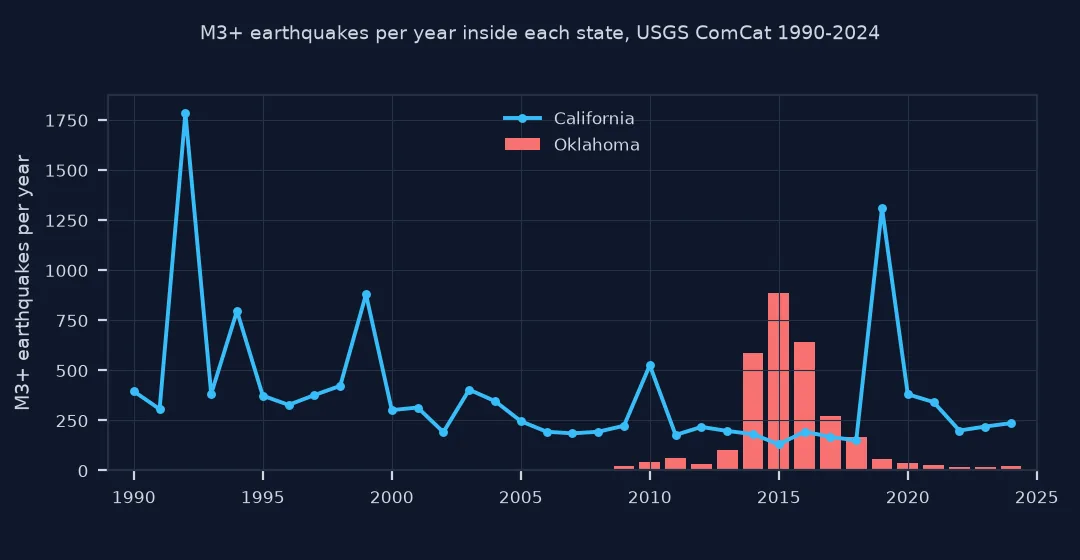
From 1990 to 2008 Oklahoma averaged 1.4 M3+ earthquakes a year. The count went to 20 in 2009 and 41 in 2010, to 585 in 2014 and to a peak of 887 in 2015, 648 times the background. It then fell almost as fast: 272 in 2017, 36 in 2020, and between 15 and 26 a year from 2021 to 2024.
Compare with California, locate the earthquakes, the decline
1. Compare with California
A rate means more next to another. Count M3+ earthquakes in California for the same years from the same catalogue:
ca_year = ca.groupby(ca.time.dt.year).size().reindex(range(1990, 2025), fill_value=0)
both = pd.DataFrame({"Oklahoma": per_year, "California": ca_year})
print(both.loc[2013:2017].to_string())
print(f"years Oklahoma exceeded California: {list(both.index[both.Oklahoma > both.California])}")
Oklahoma California
time
2013 103 197
2014 585 181
2015 887 130
2016 639 194
2017 272 167
years Oklahoma exceeded California: [2014, 2015, 2016, 2017, 2018]
California, with the San Andreas system, had between 130 and 197 M3+ earthquakes a year in these five years. Oklahoma passed it in 2014 and stayed above it until 2018; in 2015 it had almost seven times as many. California's own peaks, 1992 and 2019, are aftershock sequences of single large earthquakes, Landers and Ridgecrest; Oklahoma's peak was years long and had no single mainshock.
2. Where the earthquakes were
Count events in grid cells of 0.25° for three periods and see how concentrated and where they were:
periods = {"1990-2008": (1990, 2008), "2009-2013": (2009, 2013), "2014-2016": (2014, 2016), "2017-2024": (2017, 2024)}
for name, (a, b) in periods.items():
    sub = ok[ok.time.dt.year.between(a, b)]
    cells = sub.groupby([(sub.latitude // 0.25) * 0.25, (sub.longitude // 0.25) * 0.25]).size()
    top = cells.idxmax() if len(cells) else (np.nan, np.nan)
    print(f"{name}: {len(sub):>5,} events in {len(cells):>3} cells; busiest cell {top[0]:.2f}N {abs(top[1]):.2f}W with {cells.max() if len(cells) else 0}; "
          f"centroid {sub.latitude.mean():.2f}N {abs(sub.longitude.mean()):.2f}W")
1990-2008: 26 events in 21 cells; busiest cell 34.75N 97.75W with 3; centroid 35.12N 97.46W
2009-2013: 261 events in 38 cells; busiest cell 35.50N 97.25W with 52; centroid 35.55N 97.06W
2014-2016: 2,111 events in 59 cells; busiest cell 35.75N 97.50W with 198; centroid 36.31N 97.67W
2017-2024: 611 events in 69 cells; busiest cell 36.25N 99.00W with 52; centroid 36.19N 97.74W
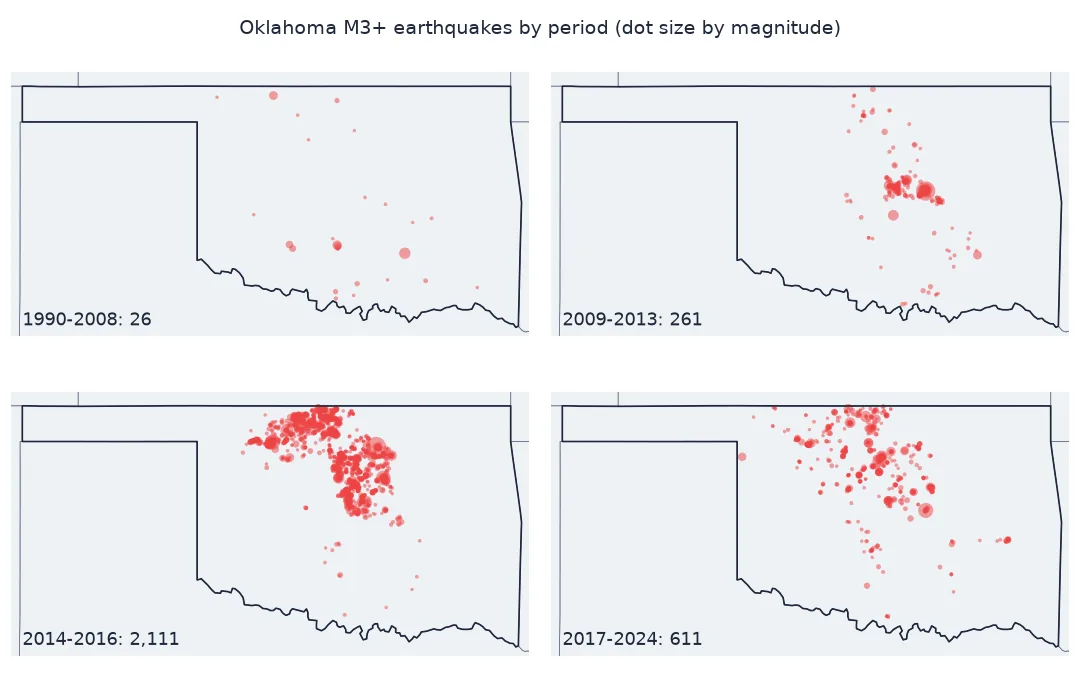
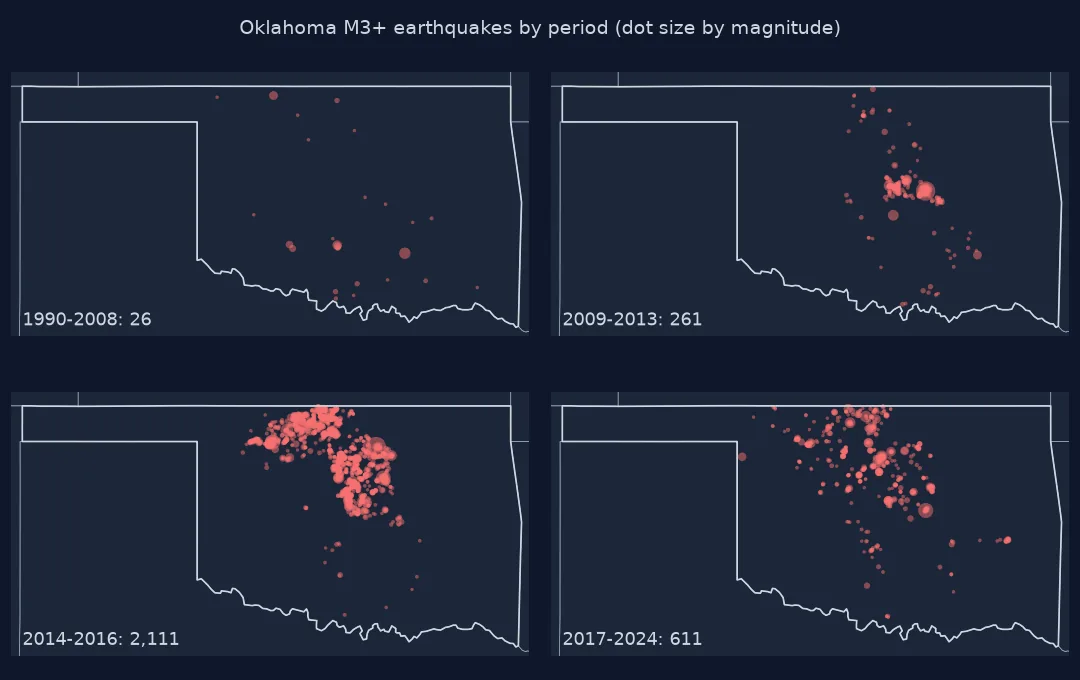
Before 2009 the 26 earthquakes were scattered over 21 cells, never more than 3 in one. From 2009 to 2013 activity concentrated in central Oklahoma, with the busiest cell just east of Oklahoma City. In 2014–2016 the 2,111 events spread over 59 cells and the centroid moved about 100 km north-north-west, towards the Kansas border, with 198 events in the busiest cell. Since 2017 the busiest cell is in the north-west, at 36.25°N 99.00°W: the activity moved as disposal moved.
3. Decline after 2015
Fit the yearly counts after the peak to an exponential decay and give the half-life:
after = per_year.loc[2016:2024]
k, lnA = np.polyfit(after.index - 2016, np.log(after.values), 1)
print(f"after 2016 the yearly count halves every {np.log(2) / -k:.1f} years")
print(f"2024: {per_year[2024]} events, still {per_year[2024] / base:.0f} times the 1990-2008 rate")
after 2016 the yearly count halves every 1.5 years
2024: 23 events, still 17 times the 1990-2008 rate
An exponential fit to 2016–2024 halves the yearly count every 1.5 years. But the decline has flattened since 2021, at 15 to 26 a year, and 2024's 23 events are still 17 times the 1990–2008 rate.
Oklahoma's largest earthquakes
The data used on this page
Earthquakes of magnitude 3 or more from 1990 to 2024 from the USGS FDSN event service, for boxes around Oklahoma and California, clipped to the state boundaries from the US Census Bureau's cartographic boundary files (2023, 1:20 million).
from pathlib import Path

import geopandas as gpd
import numpy as np
import pandas as pd
import requests

Path("data").mkdir(exist_ok=True)
def cached(path, url, **params):
    p = Path(path)
    if not p.exists():
        r = requests.get(url, params=params, timeout=600)
        r.raise_for_status()
        p.write_bytes(r.content)
    return p
states = gpd.read_file(cached("data/cb_2023_us_state_20m.zip", "https://www2.census.gov/geo/tiger/GENZ2023/shp/cb_2023_us_state_20m.zip")).to_crs(4326)
def quakes(state, box):
    p = cached(f"data/{state.lower()}_m3_1990_2024.csv", "https://earthquake.usgs.gov/fdsnws/event/1/query", format="csv",
               starttime="1990-01-01", endtime="2025-01-01", minmagnitude=3, orderby="time-asc", **box)
    d = pd.read_csv(p)
    assert len(d) < 20000
    d = d[d["type"] == "earthquake"]
    g = gpd.GeoDataFrame(d, geometry=gpd.points_from_xy(d.longitude, d.latitude), crs=4326)
    g = g[g.within(states[states.NAME == state].geometry.iloc[0])].copy()
    g["time"] = pd.to_datetime(g.time)
    return g
ok = quakes("Oklahoma", dict(minlatitude=33.6, maxlatitude=37.1, minlongitude=-103.1, maxlongitude=-94.4))
ca = quakes("California", dict(minlatitude=32.5, maxlatitude=42.1, minlongitude=-124.5, maxlongitude=-114.1))
print(f"Oklahoma: {len(ok):,} M3+ earthquakes 1990-2024; California: {len(ca):,}")
Oklahoma: 3,009 M3+ earthquakes 1990-2024; California: 13,259
Inside the state boundaries, Oklahoma had 3,009 M3+ earthquakes from 1990 to 2024 and California 13,259.
Example 1: the largest earthquakes
List the five largest Oklahoma earthquakes since 1990:
cols = ["time", "mag", "magType", "depth", "place"]
print(ok.nlargest(5, "mag")[cols].assign(time=lambda d: d.time.dt.strftime("%Y-%m-%d")).to_string(index=False))
time mag magType depth place
2016-09-03 5.80 mww 5.557 14 km NW of Pawnee, Oklahoma
2011-11-06 5.70 mww 5.200 8 km NW of Prague, Oklahoma
2016-02-13 5.10 mww 8.310 18 km SE of Waynoka, Oklahoma
2024-02-03 5.06 mww 3.000 8 km NW of Prague, Oklahoma
2016-11-07 5.00 mww 4.430 3 km W of Cushing, Oklahoma
The largest is the M5.8 Pawnee earthquake of 3 September 2016, the largest earthquake recorded in Oklahoma, followed by the M5.7 Prague earthquake of November 2011. Three of the five largest happened in 2016. All five are shallow, 3 to 8 km deep. An M5.06 near Prague in February 2024 shows the faults are still capable of large events while the rate is low.
Earthquakes caused by wastewater injection
Induced earthquakes are caused by human activity that changes the stress or the fluid pressure on faults. In Oklahoma, the dominant cause identified by the USGS and the Oklahoma Geological Survey is the injection of wastewater into the Arbuckle Group, a deep formation that sits on crystalline basement rock full of faults oriented close to failure in the present stress field. Raising the pore pressure on those faults lowers the friction that holds them, and earthquakes follow, sometimes tens of kilometres from the wells and years after injection begins.
Analysing it from a catalogue is mostly careful counting. The magnitude threshold must be above completeness for the whole period, which is why this page counts M3 and larger rather than the smaller events whose detection improved most after 2010; rates must be compared with a background and, ideally, with a region where nothing changed; and maps by period show what totals cannot, that the activity moved as injection moved. What the catalogue cannot show is the cause: linking earthquakes to wells needs injection volumes and pressures, which the Oklahoma Corporation Commission publishes, and the 2015–2016 orders that cut disposal volumes are why the counts fell.
State boundaries, completeness and declustering
- State boundaries: clip to the state polygon, not the box; the Oklahoma box includes parts of Kansas, Texas and Arkansas, which have induced earthquakes of their own.
- Magnitude types: Oklahoma magnitudes mix local and moment magnitudes; counts at M3 are robust to that, b-values less so.
- Completeness: below M3 the catalogue improved greatly as stations were added after 2010; counting smaller events would exaggerate the rise.
- Declustering: large events such as the 2011 Prague and 2016 Pawnee earthquakes had aftershock sequences that inflate their years.
Internal links
- Earthquake counts rise over time in my catalogue — when a rise is the catalogue, not the Earth
- How to estimate the probability of an earthquake from a catalogue in Python — rates into probabilities
- How to estimate b-value and completeness in Python
FAQ
Why did Oklahoma have so many earthquakes?
The USGS and the Oklahoma Geological Survey attribute the increase from 2009 to injection of wastewater from oil and gas production into deep formations, which raised fluid pressure on faults.
How many earthquakes did Oklahoma have in 2015?
887 of magnitude 3 or more in the USGS catalogue, the peak year, against an average of 1.4 a year from 1990 to 2008.
Have Oklahoma's earthquakes stopped?
They have fallen sharply since 2016, after regulators limited disposal volumes, but in 2024 there were still 23 M3+ earthquakes, 17 times the 1990–2008 average.
How do I clip earthquakes to a state in Python?
Make a GeoDataFrame from the latitude and longitude columns and keep the points within the state's polygon from the Census Bureau's boundary files.