
Land Cover Change Explained
On this page
Problem statement
"How much land changed?" sounds like a subtraction: map the area twice and count the pixels that differ. The count you get depends far more on how the maps were made than on what happened on the ground. Two maps classified independently disagree on edges and similar classes even where nothing changed. Maps built as a consistent series suppress that, but only by imposing rules about which changes are possible. And a single number for change hides the difference between land that moved between classes and the net result.
This page compares two ways of measuring two years of change in Williamson County, Texas, a fast-growing county north of Austin: NLCD 2019 to 2021, a series designed for change, and ESA WorldCover 2020 to 2021, two independent maps. It then splits twenty years of NLCD change into its gross and net parts.
Quick answer
Count the share of pixels that differ between two maps, and compare it with what plausibly happened:
nlcd_diff = ((N2019 != N2021) & (N2019 > 0) & (N2021 > 0)).sum() / ((N2019 > 0) & (N2021 > 0)).sum()
wc_valid = (W2020 > 0) & (W2021 > 0)
wc_diff = ((W2020 != W2021) & wc_valid).sum() / wc_valid.sum()
dev_growth = (np.isin(N2021, DEV).sum() - np.isin(N2019, DEV).sum()) * 900 / 1e6
print(f"NLCD 2019→2021: {nlcd_diff:.1%} of pixels differ; WorldCover 2020→2021: {wc_diff:.1%}")
print(f"developed land added 2019→2021 (NLCD): {dev_growth:.1f} km², {dev_growth / (wc_valid.sum() * WC_PX_KM2):.1%} of the county")
NLCD 2019→2021: 2.3% of pixels differ; WorldCover 2020→2021: 13.5%
developed land added 2019→2021 (NLCD): 27.3 km², 0.9% of the county
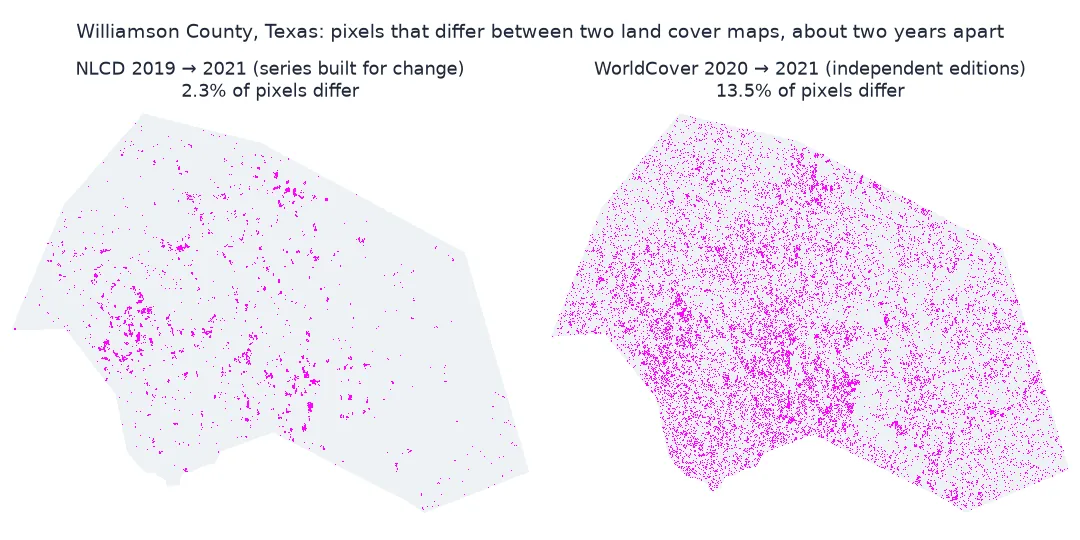
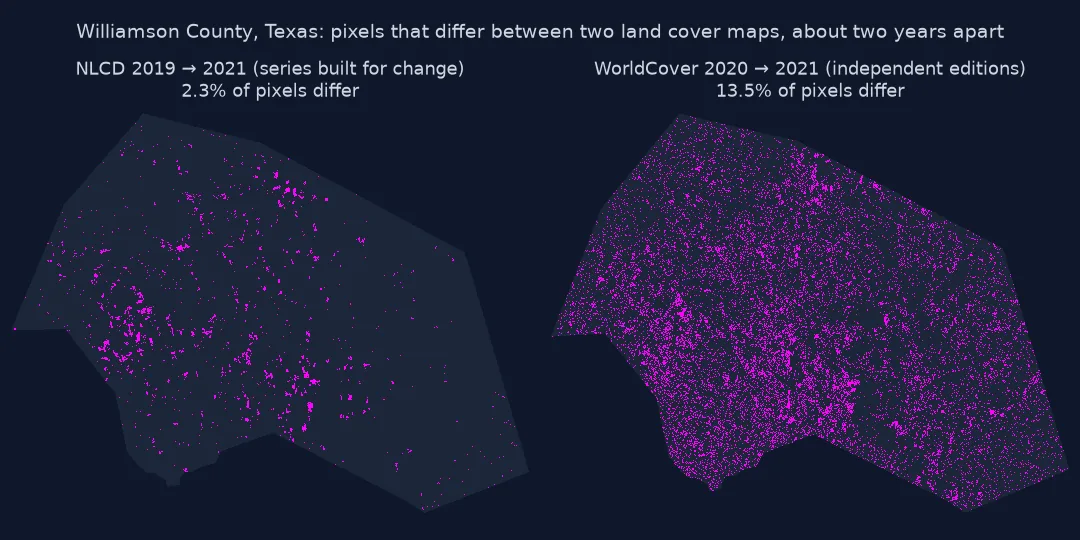
Change against disagreement, gross, net and swap
1. Separate change from disagreement
Independent maps differ wherever either one is wrong. Most WorldCover differences here are between classes that are hard to separate, not between classes that change quickly:
G = {10: "Tree", 20: "Shrub", 30: "Grass", 40: "Crop", 50: "Built", 60: "Bare", 80: "Water", 90: "Wetland", 100: "Grass"}
pairs = pd.Series(list(zip(W2020[wc_valid & (W2020 != W2021)], W2021[wc_valid & (W2020 != W2021)]))).map(lambda p: f"{G[p[0]]} → {G[p[1]]}")
print((pairs.value_counts(normalize=True).head(5) * 100).round(1).to_string())
Grass → Tree 20.1
Bare → Grass 18.9
Crop → Grass 17.0
Grass → Crop 10.0
Tree → Built 4.6
Grass becoming trees, bare ground becoming grass and crops becoming grass make up more than half of the differences. These are classes a classifier struggles to separate, and pairs of them that real change rarely links within a year or two.
2. Gross change, net change and swap
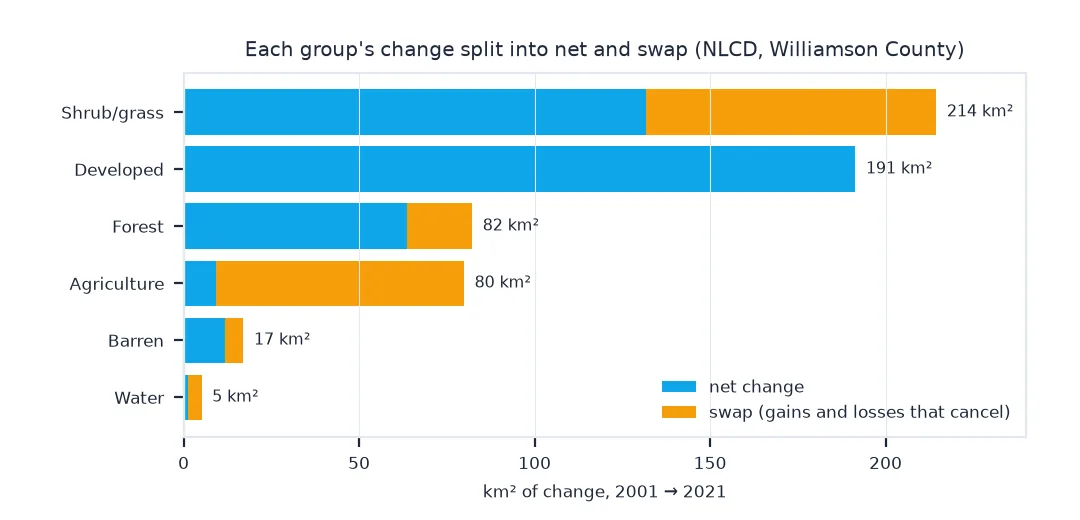
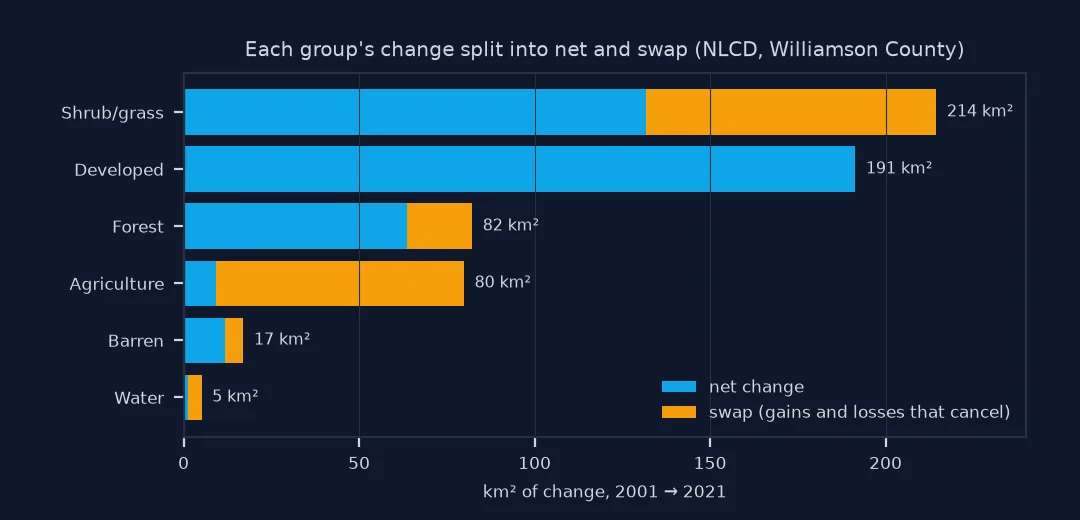
Over a longer period, change has three parts. Gross change counts every pixel that changed. Net change is the difference in class totals. Swap is change that cancels out: a class gaining in one place and losing as much elsewhere.
g01 = pd.Series(N2001[N2001 > 0]).map(GROUP); g21 = pd.Series(N2021[N2001 > 0]).map(GROUP)
m = pd.crosstab(g01, g21) * 900 / 1e6
persist = pd.Series(np.diag(m), index=m.index)
gain, loss = m.sum(axis=0) - persist, m.sum(axis=1) - persist
print(f"gross change {(gain.sum()):,.1f} km²; net change {(gain - loss).clip(lower=0).sum():,.1f} km²; swap {(2 * np.minimum(gain, loss)).sum() / 2:,.1f} km²")
print(pd.DataFrame({"gain": gain, "loss": loss, "net": gain - loss}).round(1).sort_values("net").to_string())
gross change 295.1 km²; net change 204.3 km²; swap 90.7 km²
gain loss net
Shrub/grass 41.4 173.1 -131.6
Forest 9.3 72.9 -63.5
Agriculture 35.4 44.5 -9.2
Water 3.2 1.9 1.2
Barren 14.4 2.7 11.7
Developed 191.4 0.0 191.4
3. Read the product's rules
A consistent series keeps unchanged pixels exactly the same, and it decides which changes it can record. In NLCD, developed land does not revert:
lost = (np.isin(N2001, DEV) & ~np.isin(N2021, DEV) & (N2021 > 0)).sum()
print(f"pixels developed in 2001 but not in 2021: {lost} of {np.isin(N2001, DEV).sum():,}")
pixels developed in 2001 but not in 2021: 8 of 368,665
The same question asked of two products
The data used on this page
NLCD 2001, 2019 and 2021 (2021 release, 30 m) from MRLC's WCS and ESA WorldCover 2020 (v100) and 2021 (v200), tile N30W099 from the public S3 bucket, each masked to the 2023 Census outline of Williamson County, Texas.
import time
from pathlib import Path

import geopandas as gpd
import numpy as np
import pandas as pd
import rasterio
import rasterio.mask
import requests

Path("data").mkdir(exist_ok=True)
if not Path("data/cb_2023_us_county_20m.zip").exists():
    Path("data/cb_2023_us_county_20m.zip").write_bytes(requests.get("https://www2.census.gov/geo/tiger/GENZ2023/shp/cb_2023_us_county_20m.zip", timeout=300).content)
COUNTY = gpd.read_file("data/cb_2023_us_county_20m.zip").query("GEOID == '48491'")


def nlcd(year):
    p = Path(f"data/nlcd_{year}.tif")
    c = COUNTY.to_crs(5070)
    if not p.exists():
        x0, y0, x1, y1 = c.total_bounds
        for attempt in range(4):
            r = requests.get("https://www.mrlc.gov/geoserver/mrlc_download/wcs", params={"service": "WCS", "version": "2.0.1", "request": "GetCoverage",
                             "coverageId": f"mrlc_download__NLCD_{year}_Land_Cover_L48", "subset": [f"X({x0},{x1})", f"Y({y0},{y1})"], "format": "image/geotiff"}, timeout=300)
            if r.status_code < 500:
                break
            time.sleep(15 * (attempt + 1))
        r.raise_for_status()
        p.write_bytes(r.content)
    with rasterio.open(p) as src:
        return rasterio.mask.mask(src, c.geometry, crop=True, nodata=0)[0][0]


def worldcover(version, year):
    url = f"/vsicurl/https://esa-worldcover.s3.eu-central-1.amazonaws.com/{version}/{year}/map/ESA_WorldCover_10m_{year}_{version}_N30W099_Map.tif"
    with rasterio.open(url) as src:
        return rasterio.mask.mask(src, COUNTY.to_crs(4326).geometry, crop=True, nodata=0)[0][0]


N2001, N2019, N2021 = nlcd(2001), nlcd(2019), nlcd(2021)
W2020, W2021 = worldcover("v100", 2020), worldcover("v200", 2021)
WC_PX_KM2 = 9.26 * 9.26 * np.cos(np.radians(30.7)) / 1e6        # one 1/12,000° pixel at the county's latitude
DEV = [21, 22, 23, 24]
GROUP = {11: "Water", 90: "Water", 95: "Water", 21: "Developed", 22: "Developed", 23: "Developed", 24: "Developed", 31: "Barren",
         41: "Forest", 42: "Forest", 43: "Forest", 52: "Shrub/grass", 71: "Shrub/grass", 81: "Agriculture", 82: "Agriculture"}
print(f"NLCD grids {N2021.shape}; WorldCover grids {W2021.shape}")
NLCD grids (1884, 2845); WorldCover grids (6019, 10737)
Example 1: the same question asked of both products
wc_built = ((W2021 == 50).sum() - (W2020 == 50).sum()) * WC_PX_KM2
print(f"built-up change, WorldCover 2020→2021: {wc_built:+.1f} km²; developed change, NLCD 2019→2021: {dev_growth:+.1f} km²")
built-up change, WorldCover 2020→2021: +24.3 km²; developed change, NLCD 2019→2021: +27.3 km²
The net change in built-up land is close in both products. Totals can agree while the maps disagree pixel by pixel, which is why a change map from independent products should never be read pixel by pixel.
Real change plus two maps' errors
A change map from two land cover maps measures three things at once: real change, the errors of the first map, and the errors of the second. Real change in a year or two is small, a few per cent at most even in a fast-growing county, so the errors easily dominate. Products designed for change, such as NLCD's consistent series, detect change first, with methods tuned to change, and carry unchanged pixels over unaltered; their year-to-year differences are mostly real. Independent annual maps such as WorldCover's two editions were not built to be differenced, and here they disagree on roughly six times as many pixels.
Gross, net and swap describe change that is real. Net change answers "how much more developed land is there?" Gross change answers "how much land changed hands?", always at least as large. Swap shows how much movement cancels out, like agriculture here, which gained and lost tens of square kilometres for a small net loss. Reporting only net change hides that churn; reporting only gross change from independent maps reports their errors.
Interval length, same grids and units
- Interval length: compare rates per year; NLCD years are two or three years apart.
- Same grid: both maps on one grid, with nearest-neighbour resampling if one must move.
- Rules cut both ways: "developed never reverts" removes false losses but also real ones, such as demolition to parkland.
- Area units: WorldCover pixels are in degrees; convert with the true pixel area at the latitude.
- Accuracy: a map with 80% accuracy can show at most 20% false change per map; with two maps, more.
Internal links
- How to build a land cover change matrix — the matrix behind gross, net and swap
- Why is my land cover change map full of speckle? — disagreement as speckle
FAQ
How do I measure land cover change?
From a product series designed for change where one exists, cross-tabulating the two years; differencing independent maps measures their disagreement as much as change.
What is the difference between gross and net land cover change?
Gross change counts every area that changed class; net change is the difference between class totals. Gross is always at least as large.
What is swap change?
Change that cancels out: a class gains in some places and loses as much in others, so its net change is small while its gross change is large.
Can I compare ESA WorldCover 2020 and 2021 for change?
Not reliably. The two editions used different algorithm versions, and in a fast-growing Texas county they disagree on about six times as many pixels as NLCD records changing over a similar period.