
How to Analyse SNOTEL Snow Water Equivalent in Python
On this page
Problem statement
In the western United States, most of the summer's water falls as winter snow, and the network that measures it is SNOTEL: around 900 automated stations run by the Natural Resources Conservation Service, each weighing the snowpack every day. Its key measurement is snow water equivalent (SWE) — the depth of water you would get by melting the snow — and the questions asked of it are always the same: how big was this year's peak, when did it come, when did the snow melt out, and is any of that changing?
The data are free through an open REST API, but they arrive in inches, on water years that begin in October, with some elements starting decades later than others. This page fetches 45 water years from the Niwot station in Colorado's Front Range, computes peak SWE, peak date and melt-out date, and tests whether they have changed.
Quick answer
Ask the AWDB API for daily WTEQ, convert to millimetres, index by water year, and take the maximum and the first snow-free day after it:
url = ("https://wcc.sc.egov.usda.gov/awdbRestApi/services/v1/data?stationTriplets=663:CO:SNTL"
       "&elements=WTEQ,SNWD&duration=DAILY&beginDate=1980-10-01&endDate=2025-09-30")
d = to_frame(requests.get(url, timeout=120).json())
d["swe_mm"] = d["WTEQ"] * 25.4
d["wy"] = (d.index + pd.DateOffset(months=3)).year              # 1 October starts the next water year
d = d[d.wy.between(1981, 2025)]
peak = d.groupby("wy").swe_mm.max()
peak_day = d.groupby("wy").swe_mm.idxmax()
print(f"{len(peak)} water years; median peak {peak.median():.0f} mm on day {peak_day.dt.dayofyear.median():.0f}; "
      f"lowest {peak.min():.0f} mm in {peak.idxmin()}, highest {peak.max():.0f} mm in {peak.idxmax()}")
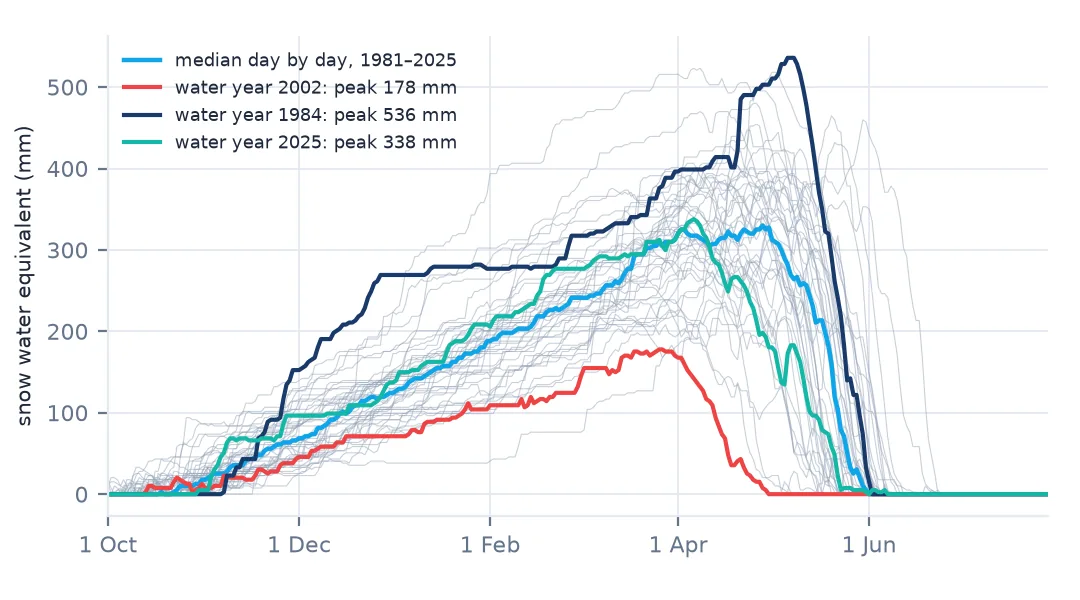
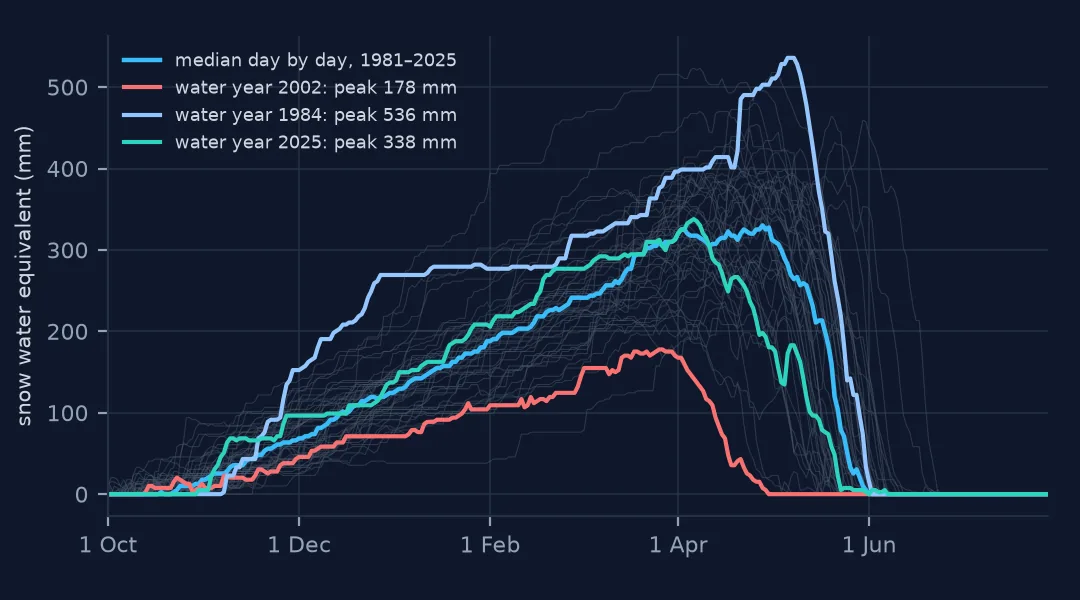
45 water years; median peak 378 mm on day 103; lowest 178 mm in 2002, highest 536 mm in 1984
Find the station, use water years, peak and melt-out
1. Find the station and what it measures
Every SNOTEL station has a triplet — station number, state, network. The station endpoint gives its metadata; elements started on different dates, which matters for any long-term analysis:
meta = requests.get("https://wcc.sc.egov.usda.gov/awdbRestApi/services/v1/stations"
                    "?stationTriplets=663:CO:SNTL", timeout=60).json()[0]
print({k: meta[k] for k in ("name", "elevation", "latitude", "longitude", "beginDate")})
print({c: str(d[c].first_valid_index().date()) for c in ("WTEQ", "SNWD")})
{'name': 'Niwot', 'elevation': 9940.0, 'latitude': 40.03581, 'longitude': -105.5452, 'beginDate': '1979-10-01 00:00'}
{'WTEQ': '1980-10-01', 'SNWD': '2005-07-28'}
Niwot sits at 9,940 ft (3,030 m) just below the Continental Divide. SWE has been recorded since 1980 from a snow pillow; snow depth from an ultrasonic sensor only since 2005.
2. Work in water years
A water year runs from 1 October to 30 September and is named for the year it ends in, so the winter of 2024–25 is water year 2025. Grouping by calendar year would split every winter in two. Adding three months to each date and taking the year does the conversion; keep only complete water years.
3. Peak, peak date and melt-out
Peak SWE is the most water the pack held. Melt-out is the first day after the peak with no snow left:
def melt_out(g):
    after = g.loc[g.swe_mm.idxmax():]
    zero = after[after.swe_mm == 0]
    return zero.index[0] if len(zero) else pd.NaT

out = d.groupby("wy").apply(melt_out)
print("melt-out, median:", f"day {out.dt.dayofyear.median():.0f}", "| 2025:", out.loc[2025].date(),
      "| earliest:", out.dt.dayofyear.idxmin(), out.loc[out.dt.dayofyear.idxmin()].date())
melt-out, median: day 152 | 2025: 2025-06-01 | earliest: 2002 2002-04-30
4. Test for change, and believe the answer
Fit linear trends to each of the three and look at their size against the year-to-year spread:
for label, series in (("peak SWE (mm)", peak), ("peak date (day of year)", peak_day.dt.dayofyear),
                      ("melt-out (day of year)", out.dt.dayofyear)):
    slope = np.polyfit(series.index, series.values, 1)[0] * 10
    r = stats.spearmanr(series.index, series.values)
    print(f"{label:24} trend {slope:+6.1f} per decade; year-to-year SD {series.std():5.1f}; "
          f"Spearman rho {r.statistic:+.2f}, p = {r.pvalue:.2f}")
peak SWE (mm) trend +2.5 per decade; year-to-year SD 81.6; Spearman rho +0.03, p = 0.86
peak date (day of year) trend -0.3 per decade; year-to-year SD 17.4; Spearman rho +0.01, p = 0.95
melt-out (day of year) trend +1.2 per decade; year-to-year SD 10.9; Spearman rho +0.19, p = 0.21
At Niwot, none of the three shows a trend distinguishable from its own year-to-year variation over 1981–2025. That is a result, not a failure: a high, cold site on the Divide is among the places where warming shows least in the snowpack, and 45 noisy years cannot resolve a small change. Regional studies built on hundreds of stations find declines that a single station cannot show.
5. Use snow depth to get density
Where both are measured, SWE divided by depth is the bulk density of the pack — fresh powder near 100 kg/m³, spring corn snow over 400. It tells you what kind of snow is there:
m = d.SNWD >= 5
density = (d.WTEQ / d.SNWD)[m] * 1000
print(density.groupby(density.index.month).median().round().loc[[11, 1, 3, 5]].to_string())
date
11 221.0
1 238.0
3 280.0
5 400.0
Niwot against a neighbour and its own record
The data used on this page
NRCS SNOTEL station Niwot (663:CO:SNTL), daily snow water equivalent (WTEQ) and snow depth (SNWD), water years 1981–2025, from the NRCS Air and Water Database REST API. Values are as provisionally or finally edited by NRCS at download.
import numpy as np
import pandas as pd
import requests
from scipy import stats

def to_frame(payload):
    """AWDB data response -> DataFrame, one column per element, indexed by date."""
    cols = {}
    for el in payload[0]["data"]:
        v = pd.DataFrame(el["values"])
        cols[el["stationElement"]["elementCode"]] = v.set_index(pd.to_datetime(v["date"]))["value"]
    return pd.DataFrame(cols)

print(to_frame([{"data": [{"stationElement": {"elementCode": "WTEQ"}, "values": [{"date": "2025-04-06", "value": 13.3}]}]}]))
WTEQ
date
2025-04-06 13.3
Example 1: compare with a station nearby
University Camp (838:CO:SNTL) is 2.6 km west and 119 m higher. Two stations this close should agree on the shape of each winter, but not on the totals:
uc = to_frame(requests.get(url.replace("663:CO:SNTL", "838:CO:SNTL").replace("WTEQ,SNWD", "WTEQ"), timeout=120).json())
uc["wy"] = (uc.index + pd.DateOffset(months=3)).year
uc_peak = uc[uc.wy.between(1981, 2025)].groupby("wy").WTEQ.max() * 25.4
both = pd.concat({"Niwot": peak, "University Camp": uc_peak}, axis=1).dropna()
print(both.describe().loc[["mean", "min", "max"]].round().to_string())
print("correlation of yearly peaks:", round(both.corr().iloc[0, 1], 2))
Niwot University Camp
mean 368.0 515.0
min 178.0 231.0
max 536.0 884.0
correlation of yearly peaks: 0.89
Example 2: this year against the record
Rank a water year's peak among all of them — the kind of statement water managers make each spring:
pct = peak.rank(pct=True)
for y in (2002, 2011, 2024, 2025):
    print(f"water year {y}: peak {peak[y]:.0f} mm, {pct[y]:.0%} of years lower or equal, "
          f"{peak[y] / peak.loc[1991:2020].median():.0%} of the 1991-2020 median")
water year 2002: peak 178 mm, 2% of years lower or equal, 47% of the 1991-2020 median
water year 2011: peak 432 mm, 82% of years lower or equal, 113% of the 1991-2020 median
water year 2024: peak 381 mm, 54% of years lower or equal, 100% of the 1991-2020 median
water year 2025: peak 338 mm, 36% of years lower or equal, 88% of the 1991-2020 median
Why SWE matters for water
SWE is the quantity that matters for water supply because it is the water, not the snow: a metre of fresh powder and 30 cm of spring snow can hold the same amount. A SNOTEL snow pillow measures it directly, as the weight of the pack on a fluid-filled bladder, which is why SWE records are long and continuous while depth records, needing a separate sensor, often start later.
The three standard metrics describe different things. Peak SWE is how much water the winter stored. Peak date is when accumulation gave way to melt. Melt-out date is when the stored water had all left the pack — the one most sensitive to spring warmth, and the one that decides how much is still available in early summer. A station can have an average peak and an early melt-out, and that combination matters more to a reservoir than the peak alone.
A single station is a point. Its year-to-year variation is large, its trends small and site-specific, and a 45-year record rarely resolves them. Results like Niwot's absence of trend are worth stating plainly, and worth not extending to the region.
Units, water years and cumulative precipitation
- Inches in, millimetres out. AWDB stores WTEQ and SNWD in inches; convert once, early.
- Water years start on 1 October. Group by
(date + 3 months).year. - Elements start at different dates; SNWD at Niwot only from 2005.
- Precipitation (PREC) is cumulative and resets each 1 October; difference it for daily values.
- Provisional data in the current water year may be revised.
- Snow pillows bridge under ice layers and can under-read; a sudden step not seen in depth is worth checking.
Internal links
- Snow water equivalent explained — what SWE is and how it is measured
- How to analyse snow depth from GHCN-Daily — the global station record
- How to find snowmelt timing — melt-out from stations and satellites
- Snow depth has gaps and zeros — cleaning station snow data
- How to analyse a sea-ice extent time series — the same habits for another record
FAQ
How do I download SNOTEL data in Python?
Use the NRCS AWDB REST API: /services/v1/data?stationTriplets=663:CO:SNTL&elements=WTEQ&duration=DAILY&beginDate=...&endDate=... returns JSON with daily values; no key is needed.
What is a SNOTEL station triplet?
The station number, state and network separated by colons, for example 663:CO:SNTL for Niwot in Colorado.
What units is SNOTEL SWE in?
Inches. Multiply by 25.4 for millimetres.
Is snowpack declining at Niwot?
Not detectably over water years 1981–2025: peak SWE, peak date and melt-out show no trend distinguishable from year-to-year variation at this single high-elevation station.