
Fixing Daily SST Series with Missing Days from ERDDAP
On this page
Problem statement
A daily sea surface temperature series downloaded from an ERDDAP server looks complete: the request asked for every day from 1991 to 2020, the server returned a valid file, and the first and last dates are right. But a climatology built from it is noisy in some seasons, a heatwave count is low, and a rolling mean over "30 days" spans six weeks. The aggregation behind the server is missing days. ERDDAP returns whatever dates exist between the requested start and stop, without an error for the ones that do not, and a server's aggregation of tens of thousands of daily files can lack some of them.
This page counts the days per year in two ERDDAP aggregations of NOAA OISST, finds where one of them has gaps, measures what the gaps do to a climatology, adds a check that stops an analysis before it runs on an incomplete series, and fills the gaps from NCEI's daily files.
Quick answer
Ask ERDDAP for the time axis only, which is cheap, and compare the count per year with the calendar:
def times(server, dataset, start, stop):
    r = requests.get(f"{server}/griddap/{dataset}.csv?time[({start}T12:00:00Z):1:({stop}T12:00:00Z)]", timeout=300)
    r.raise_for_status()
    t = pd.to_datetime(pd.read_csv(io.StringIO(r.text), skiprows=[1]).time)
    return t[(t.dt.year >= int(start[:4])) & (t.dt.year <= int(stop[:4]))]      # ERDDAP snaps the ends to the nearest date
def days_per_year(server, dataset, start, stop):
    n = times(server, dataset, start, stop).dt.year.value_counts().sort_index()
    full = pd.Series(pd.date_range(start, stop).year).value_counts().sort_index()   # days asked for, per year
    gaps = full.sub(n, fill_value=0).astype(int)
    return gaps[gaps > 0]
gaps = days_per_year(CW, "ncdcOisst21Agg", "1982-01-01", "2023-12-31")
print(f"CoastWatch OISST v2.1 aggregation, 1982-2023: {gaps.sum():,} missing days in {len(gaps)} years")
print(gaps.to_string())
CoastWatch OISST v2.1 aggregation, 1982-2023: 1,192 missing days in 10 years
1992 41
1993 203
1994 227
1995 195
1996 196
1997 189
1998 126
2021 2
2022 1
2023 12
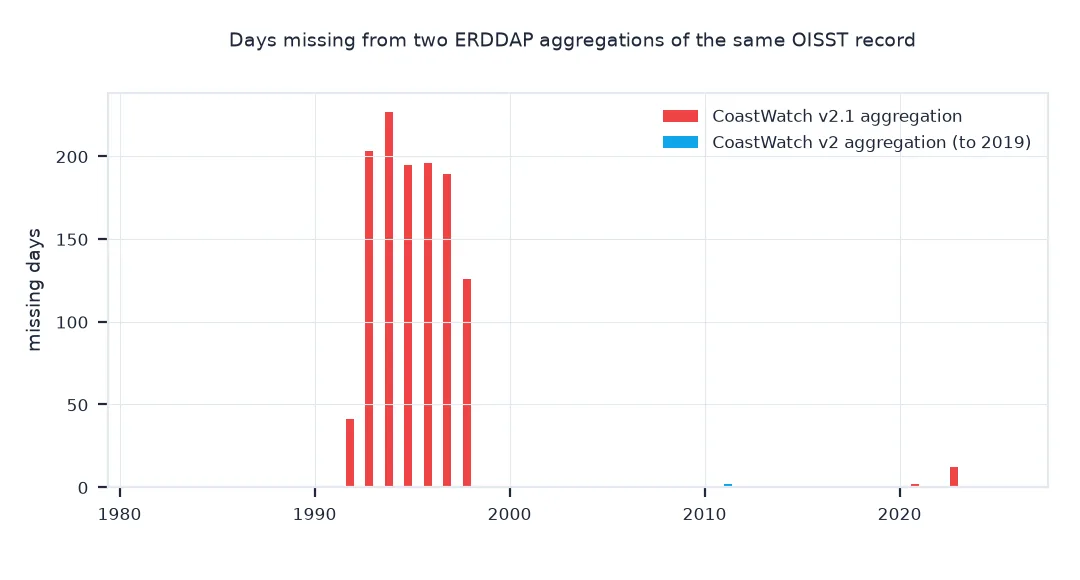
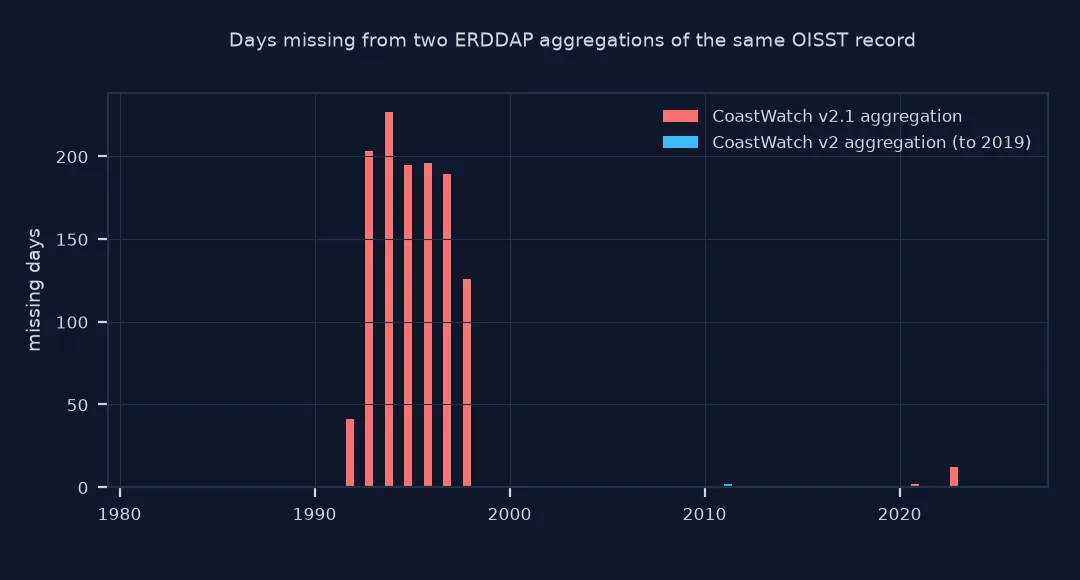
Between 1982 and 2023, CoastWatch's version 2.1 aggregation lacks 1,192 days. Almost all of them are in 1992–1998, where five years are missing more than half their days, but 2021–2023 are short too, by 15 days in all.
Compare aggregations, find the gaps, see their effect
1. Compare aggregations of the same product
The same OISST record is served by more than one aggregation, and NCEI publishes the daily files they are built from. Count each aggregation over the years it covers, and ask the archive for the days the newer one lacks:
for label, ds, a, b in (("CoastWatch v2", "ncdcOisst2Agg", "1982-01-01", "2019-12-31"),
                        ("CoastWatch v2.1", "ncdcOisst21Agg", "1982-01-01", "2025-12-31")):
    g = days_per_year(CW, ds, a, b)
    print(f"{label:>16} {a[:4]}-{b[:4]}: {g.sum():>5,} missing days" + (f", worst {g.idxmax()} ({g.max()} missing)" if len(g) else ""))
have = pd.DatetimeIndex(times(CW, "ncdcOisst21Agg", "2021-01-01", "2025-12-31")).tz_localize(None).normalize()
recent = pd.date_range("2021-01-01", "2025-12-31").difference(have)
found = sum(requests.head(archive_url(d), timeout=120).status_code == 200 for d in recent)
print(f"days missing from v2.1 in 2021-2025: {len(recent)}; files for them in NCEI's archive: {found}")
CoastWatch v2 1982-2019: 2 missing days, worst 2011 (2 missing)
CoastWatch v2.1 1982-2025: 1,194 missing days, worst 1994 (227 missing)
days missing from v2.1 in 2021-2025: 17; files for them in NCEI's archive: 17
The same product in CoastWatch's version 2 aggregation lacks only two days, in 2011, and NCEI's archive has a file for every one of the 17 days the v2.1 aggregation lacks since 2021. The gaps belong to one copy of the files, not to OISST.
2. Where the gaps are
Look at the dates themselves for the worst year: are they scattered, or whole stretches?
t = times(CW, "ncdcOisst21Agg", "1993-01-01", "1993-12-31").reset_index(drop=True)
step = t.diff().dt.days.dropna().astype(int).value_counts().sort_index()
print(f"1993: {len(t)} dates; spacing between dates (days: count): {({int(k): int(v) for k, v in step.items()})}")
print(f"first dates: {', '.join(t.dt.strftime('%d %b').head(8))}")
1993: 162 dates; spacing between dates (days: count): {1: 36, 2: 88, 3: 33, 4: 1, 5: 1, 15: 1, 20: 1}
first dates: 03 Jan, 05 Jan, 07 Jan, 09 Jan, 11 Jan, 12 Jan, 15 Jan, 17 Jan
In 1993 only 162 dates exist, mostly two or three days apart, with stretches of 15 and 20 days missing. A daily series from this aggregation is closer to an every-other-day series with holes, and nothing in the response said so.
3. What gaps do to a climatology
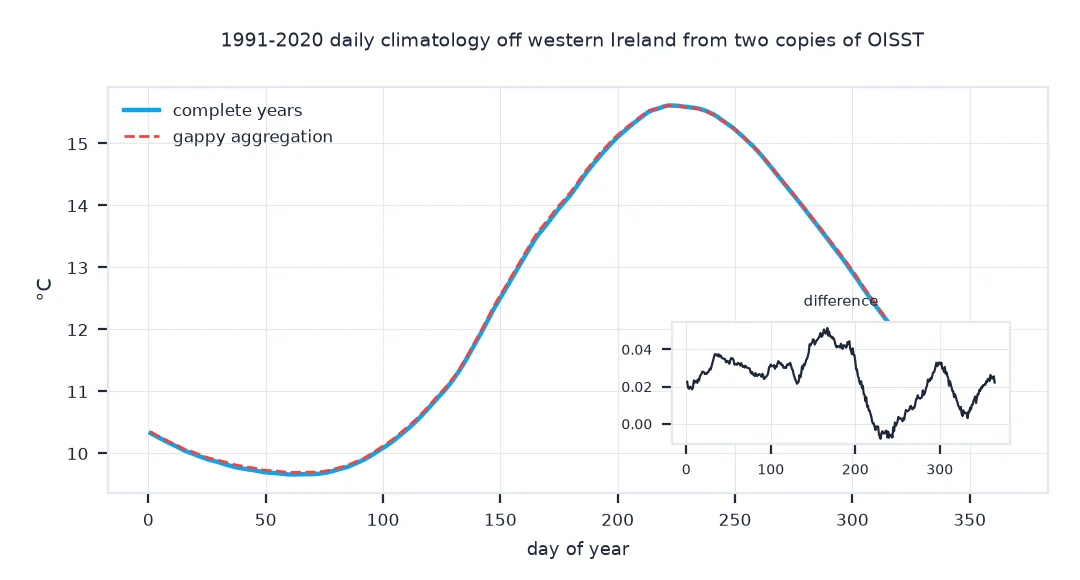
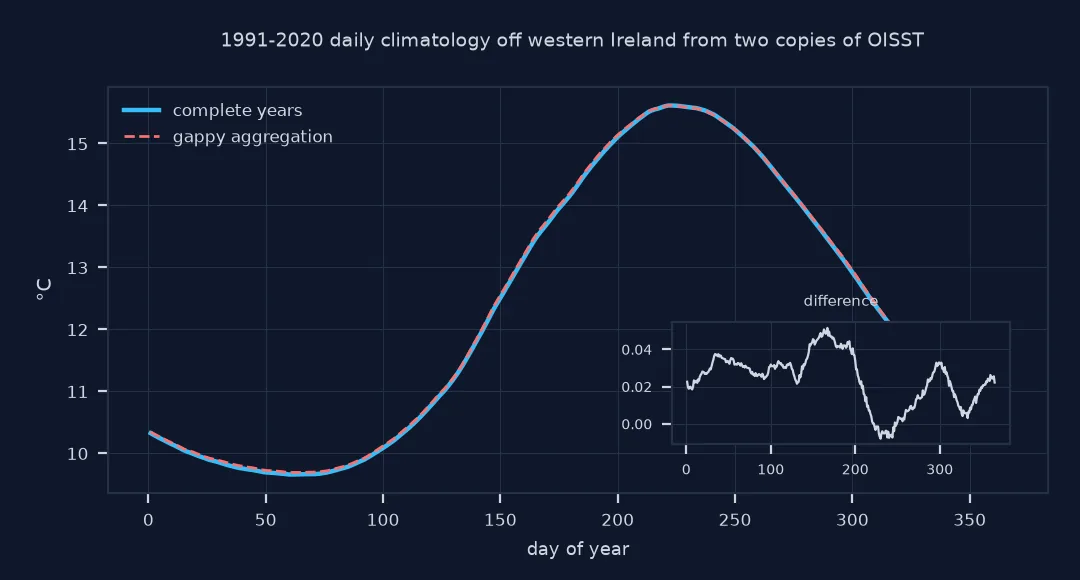
Build the same 1991–2020 daily climatology for a box west of Ireland from the gappy aggregation and from complete years, and compare:
def series(server, ds, years, tag):
    out = []
    for y in years:
        p = Path(f"data/oisst_{tag}_{y}.nc")
        if not p.exists():
            q = f"sst[({y}-01-01T12:00:00Z):1:({y}-12-31T12:00:00Z)][(0.0)][(52):1:(54)][(348):1:(350)]"   # 12 W to 10 W
            p.write_bytes(requests.get(f"{server}/griddap/{ds}.nc?{q}", timeout=600).content)
        da = xr.open_dataset(p).sst.squeeze("zlev", drop=True)
        out.append(da.weighted(np.cos(np.deg2rad(da.latitude))).mean(["latitude", "longitude"]).to_series())
    s = pd.concat(out); s.index = s.index.normalize()
    return s
years = range(1991, 2021)
gappy = series(CW, "ncdcOisst21Agg", years, "gaptest_v21_sst")
complete = pd.concat([series(CW, "ncdcOisst2Agg", range(1991, 2016), "raw_ireland_west"),
                      series(CW, "ncdcOisst21Agg", range(2016, 2021), "raw_ireland_west")])
cg, cc = clim(gappy), clim(complete)
print(f"days: gappy {len(gappy):,}, complete {len(complete):,}")
print(f"climatology difference: mean {float((cg - cc).mean()):+.3f} °C, largest {float((cg - cc).abs().max()):.3f} °C; "
      f"fewest values behind one day of year: gappy {int(gappy.groupby(doy(gappy.index)).size().min())}, complete {int(complete.groupby(doy(complete.index)).size().min())}")
days: gappy 9,785, complete 10,956
climatology difference: mean +0.024 °C, largest 0.051 °C; fewest values behind one day of year: gappy 24, complete 29
For the 1991–2020 baseline off western Ireland the gappy aggregation supplies 9,785 days against 10,956. The climatologies differ by up to 0.05 °C here, small for this box, but some days of the year rest on 24 values instead of 29, and a method that assumes consecutive days, such as heatwave runs, breaks on the gaps however small the climatology difference.
Refusing an incomplete series
The data used on this page
The time axes of two ERDDAP aggregations of NOAA OISST on coastwatch.pfeg.noaa.gov, version 2 (ncdcOisst2Agg, 1982 to April 2020) and version 2.1 (ncdcOisst21Agg), both with longitudes from 0 to 360; NCEI's daily files, one per day, which the aggregations are built from; and daily sst for 52°N to 54°N, 12°W to 10°W. NCEI states that v2 and v2.1 values are identical before 2016. NCEI's own ERDDAP copy of v2.1, complete from 2020, and CoastWatch's -180 to 180 copies were withdrawn in 2026.
import io
from pathlib import Path

import numpy as np
import pandas as pd
import requests
import xarray as xr

Path("data").mkdir(exist_ok=True)
CW = "https://coastwatch.pfeg.noaa.gov/erddap"
ARCHIVE = "https://www.ncei.noaa.gov/data/sea-surface-temperature-optimum-interpolation/v2.1/access/avhrr"
def archive_url(day):
    return f"{ARCHIVE}/{day:%Y%m}/oisst-avhrr-v02r01.{day:%Y%m%d}.nc"
def doy(idx):
    d = idx.dayofyear - ((idx.is_leap_year) & (idx.dayofyear > 59)).astype(int)
    return np.where((idx.month == 2) & (idx.day == 29), 59, d)
def clim(s):
    c = pd.Series(s.values, index=doy(s.index)).groupby(level=0).mean()
    return pd.concat([c.iloc[-15:], c, c.iloc[:15]]).rolling(31, center=True).mean().iloc[15:-15]
print(f"servers: {CW.split('/')[2]}, {ARCHIVE.split('/')[2]}")
servers: coastwatch.pfeg.noaa.gov, www.ncei.noaa.gov
The page queries CoastWatch's ERDDAP and NCEI's file archive.
Example 1: refuse to analyse an incomplete series
Put the check in front of any analysis that assumes consecutive days:
def require_daily(s):
    full = pd.date_range(s.index.min(), s.index.max(), freq="D")
    missing = full.difference(s.index)
    if len(missing):
        raise ValueError(f"{len(missing)} missing days between {s.index.min():%Y-%m-%d} and {s.index.max():%Y-%m-%d}, "
                         f"first {missing[0]:%Y-%m-%d}")
    return s
for label, s in (("gappy", gappy), ("complete", complete)):
    try:
        require_daily(s); print(f"{label}: complete, {len(s):,} days")
    except ValueError as e:
        print(f"{label}: {e}")
gappy: 1177 missing days between 1991-01-01 and 2020-12-31, first 1992-10-11
complete: 2 missing days between 1991-01-01 and 2020-12-31, first 2011-11-11
The check names the problem before anything is computed: 1,177 missing days in the gappy series, starting in October 1992, against the two known ones in 2011 in the complete series.
Example 2: fill the gaps from NCEI's daily files
When a few days are missing, take them from the files the aggregation is built from, on exactly the cells the ERDDAP files hold:
def fill_from_archive(s, like):
    """Add the days a box-mean series lacks, from NCEI's daily files, over the cells of an ERDDAP file."""
    add = {}
    for day in pd.date_range(s.index.min(), s.index.max()).difference(s.index):
        r = requests.get(archive_url(day), timeout=300)
        r.raise_for_status()
        d = xr.open_dataset(io.BytesIO(r.content)).sst.squeeze(["time", "zlev"], drop=True)
        d = d.sel(lat=like.latitude.values, lon=like.longitude.values, method="nearest")
        add[day] = float(d.weighted(np.cos(np.deg2rad(d.lat))).mean())
    return pd.concat([s, pd.Series(add)]).sort_index()
like = xr.open_dataset("data/oisst_raw_ireland_west_2011.nc").sst
filled = require_daily(fill_from_archive(complete, like))
print(f"complete after filling: {len(filled):,} days; 11 and 27 November 2011: "
      f"{filled['2011-11-11']:.2f} and {filled['2011-11-27']:.2f} °C")
complete after filling: 10,958 days; 11 and 27 November 2011: 12.25 and 11.75 °C
Two downloads complete the 30 years: 11 and 27 November 2011, at 12.25 and 11.75 °C, and the series now passes the check. The same function would fill the 17 recent days that version 2.1 lacks; for 1992–1998, where it lacks most days, take the years from version 2, which NCEI states holds the same values before 2016.
An ERDDAP dataset is an aggregation of files
An ERDDAP griddap dataset is usually an aggregation: the server indexes a directory of daily files and presents them as one array with a time axis. If a file is missing from the directory, failed to download, or was replaced by a file the server could not read, the day simply is not on the axis. A request for a range returns every date that exists in that range; nothing in the response says that others were expected. The same product on another server, built from a different copy of the files, can be complete.
Most analyses assume consecutive days without checking. A day-of-year climatology from 30 years averages fewer values for some days, a rolling window counts rows rather than days, and a marine heatwave detector treats a three-week hole as continuity or as a break, depending on how it is written. The fix is cheap: count days per year from the time axis before downloading data, choose aggregations that are complete for the years needed, and make the analysis refuse a series with holes instead of silently using it.
Near-real-time days and reindexing
- Near-real-time days: the most recent two weeks may exist only in the preliminary dataset; a gap at the end of a final aggregation is expected.
- Reindex, then decide:
s.asfreq("D")exposes gaps as NaN; whether to interpolate short gaps or drop the year depends on the method. - Different labels: some aggregations label days at 00:00 and others at 12:00; normalise timestamps before comparing two sources.
- Report it: ERDDAP administrators can rebuild an aggregation; a short message with the missing dates helps everyone using the server.
Internal links
- How to detect marine heatwaves in Python — a method that needs every day
- How to download NOAA OISST sea surface temperature in Python — ERDDAP requests
- Fixing sea surface temperature anomalies that disagree between sources — another reason two sources differ
FAQ
Why does my ERDDAP time series have missing days?
The server's aggregation lacks some daily files; ERDDAP returns the dates that exist in the requested range without reporting the ones that do not.
How do I check an ERDDAP dataset for missing days?
Request only the time axis, for example dataset.csv?time[(start):1:(stop)], and compare the number of dates per year with the calendar.
Are OISST v2 and v2.1 the same?
NCEI states that their values are identical from September 1981 to December 2015; v2.1 improved the inputs from January 2016.
Should I interpolate missing days?
A day or two can be interpolated for most purposes; long gaps should be filled from a complete copy of the same product instead.