
Sea Surface Temperature Explained
On this page
Problem statement
"Sea surface temperature" sounds like one number, but there are several surfaces. A satellite infrared radiometer sees the top tenth of a millimetre, a microwave radiometer the top millimetre, a ship's engine intake a few metres down, a buoy a metre or so. Gridded products then combine these into analyses with different resolutions, periods and methods: OISST is daily at 0.25° from 1981, ERSST monthly at 2° from 1854. The same month in the same place can differ by a few tenths of a degree between them, and each is right about what it measures.
This page compares OISST and ERSST for the North Atlantic in June 2023, looks at what each product is built from, and uses OISST's own error estimate to show where any single gridded value is least certain.
Quick answer
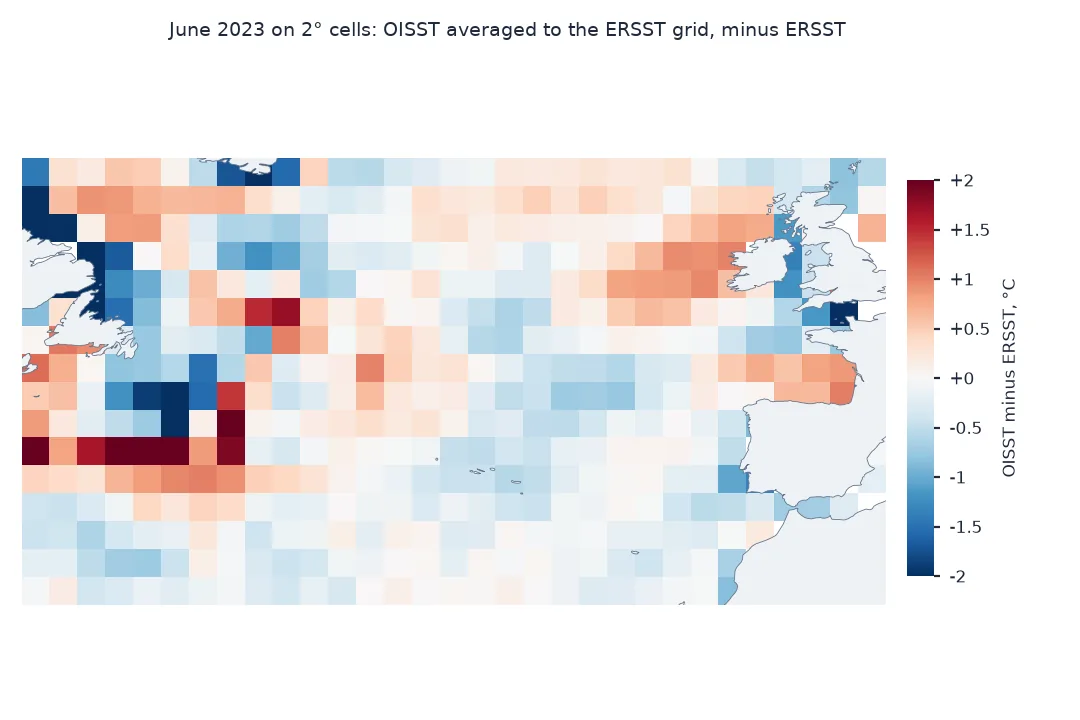
Average OISST to the ERSST grid for the same month and compare the two on the same cells:
o = oisst_june.coarsen(latitude=8, longitude=8, boundary="trim").mean()                 # 0.25° to 2°
o = o.assign_coords(latitude=o.latitude.round(0), longitude=o.longitude.round(0))
e = ersst_june.sel(latitude=o.latitude, longitude=o.longitude)
d = (o - e).where(o.notnull() & e.notnull())
w = np.cos(np.deg2rad(d.latitude))
print(f"cells compared: {int(d.notnull().sum())}; mean OISST - ERSST {float(d.weighted(w).mean()):+.2f} °C; RMS {float(np.sqrt((d ** 2).weighted(w).mean())):.2f} °C")
print(f"largest differences: {float(d.min()):+.2f} to {float(d.max()):+.2f} °C")
cells compared: 459; mean OISST - ERSST -0.08 °C; RMS 0.71 °C
largest differences: -3.37 to +3.27 °C
On the 459 cells of 2° where both products have data, June 2023 OISST averaged to the ERSST grid is 0.08 °C cooler than ERSST on average, with an RMS difference of 0.71 °C, and individual cells differ by more than 3 °C either way.
What each product says it is, where they disagree, uncertainty
1. What each product says it is
The datasets describe themselves in their metadata. Read the resolution, coverage and sources from each:
for name, ds in (("OISST", OI_META), ("ERSST", ER_META)):
    print(f"{name}: {ds['title'][:70]}")
    print(f"   from {ds['time_coverage_start'][:10]}, every {ds['res']}; source: {ds.get('source', ds.get('platform', ''))[:80]}")
OISST: SST, Daily Optimum Interpolation (OI), AVHRR Only, Version 2.1, Final,
from 1981-09-01, every day, 0.25°; source: ICOADS, NCEP_GTS, GSFC_ICE, NCEP_ICE, Pathfinder_AVHRR, Navy_AVHRR, NOAA_ACSP
ERSST: NOAA ERSSTv5 (in situ only), 2°;, Global, Monthly, 1854-present, Lon+/
from 1854-01-01, every month, 2°; source: In situ data: ICOADS R3.0 before 2016, ICOADS R3.0.2 from 2016 to present, and A
Each product's metadata names its inputs: OISST lists in situ data from ICOADS and the GTS together with AVHRR satellite data and sea-ice products; ERSST lists only in situ data from ICOADS.
2. Where the two disagree
Differences cluster where water changes over short distances, which a 2° cell averages away and a 0.25° analysis keeps. Compare the spread of OISST within each 2° cell with the difference:
spread = oisst_june.coarsen(latitude=8, longitude=8, boundary="trim").std()
spread = spread.assign_coords(latitude=spread.latitude.round(0), longitude=spread.longitude.round(0))
ok = d.notnull() & spread.notnull()
print(f"correlation of |difference| with within-cell spread: {np.corrcoef(abs(d.values[ok.values]), spread.values[ok.values])[0, 1]:.2f}")
big = d.where(abs(d) > 0.5, drop=True)
print(f"cells differing by more than 0.5 °C: {int(big.notnull().sum())}, median within-cell spread there {float(spread.where(abs(d) > 0.5).median()):.2f} °C "
      f"against {float(spread.where(abs(d) <= 0.5).median()):.2f} °C elsewhere")
correlation of |difference| with within-cell spread: 0.39
cells differing by more than 0.5 °C: 149, median within-cell spread there 0.51 °C against 0.29 °C elsewhere
The larger the spread of OISST's 0.25° values inside a 2° cell, the larger the difference tends to be: a correlation of 0.39. The 149 cells that differ by more than 0.5 °C have a median within-cell spread of 0.51 °C, against 0.29 °C elsewhere: they are where the water changes over short distances.
3. OISST's own uncertainty
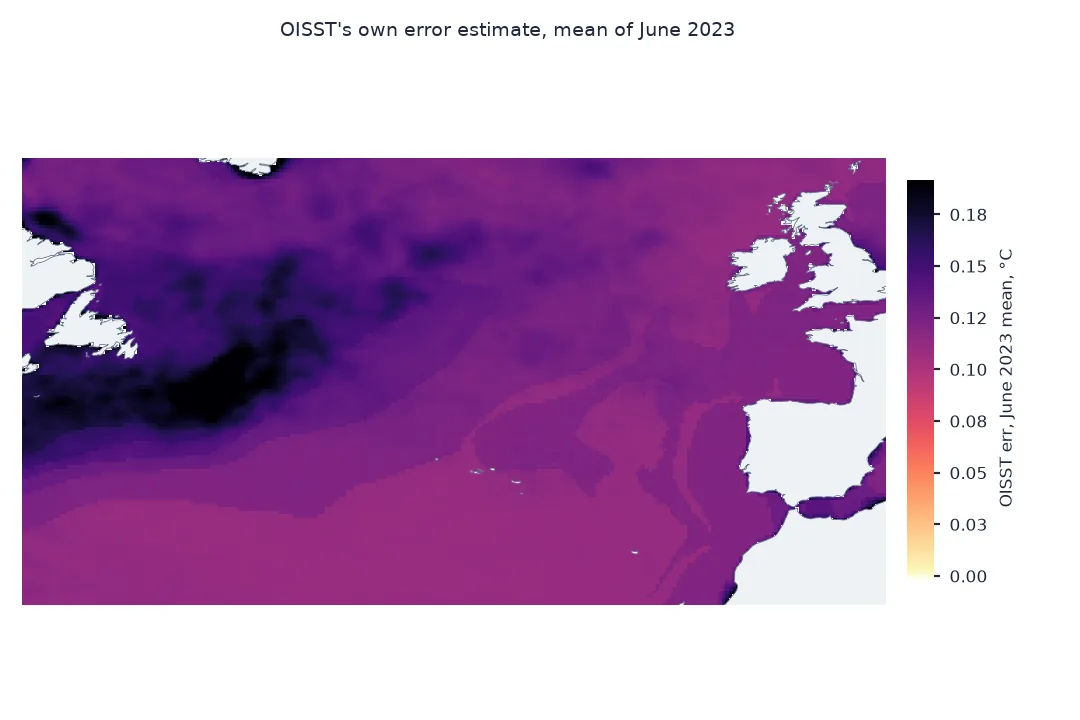
OISST carries err, the estimated standard error of each daily value. It is largest where the analysis has the fewest observations:
err = oisst_err.mean("time")
print(f"June 2023 mean err: median {float(err.median()):.2f} °C, 95th percentile {float(err.quantile(0.95)):.2f} °C, max {float(err.max()):.2f} °C")
coast = np.isnan(oisst_june).rolling(latitude=3, longitude=3, center=True, min_periods=1).max() > 0     # within one cell of land
print(f"median err within one cell of land {float(err.where(coast).median()):.2f} °C; offshore {float(err.where(~coast).median()):.2f} °C")
June 2023 mean err: median 0.12 °C, 95th percentile 0.17 °C, max 0.30 °C
median err within one cell of land 0.14 °C; offshore 0.12 °C
OISST's own error estimate for June 2023 is small everywhere in this box, a median of 0.12 °C and at most 0.30 °C, and slightly larger next to land, 0.14 °C, than offshore.
The record each product can tell
The data used on this page
Daily NOAA OISST v2.1 sst and err for June 2023, and monthly NOAA ERSST v5 for June 2023, both for 30°N to 60°N and 60°W to 0° from NOAA CoastWatch's ERDDAP (datasets ncdcOisst21Agg_LonPM180 and nceiErsstv5_LonPM180).
import io
import time
from pathlib import Path

import numpy as np
import pandas as pd
import requests
import xarray as xr

Path("data").mkdir(exist_ok=True)
CW = "https://coastwatch.pfeg.noaa.gov/erddap/griddap"
ARCHIVE = "https://www.ncei.noaa.gov/data/sea-surface-temperature-optimum-interpolation/v2.1/access/avhrr"
def _get(url):
    for attempt in range(5):                                            # a busy ERDDAP answers 500 or 503
        r = requests.get(url, timeout=900)
        if r.status_code < 500:
            break
        time.sleep(30 * (attempt + 1))
    r.raise_for_status()
    return r
def _lon180(da):
    return da.assign_coords(longitude=(da.longitude + 180) % 360 - 180).sortby("longitude")
def oisst(start, end, path, var="sst", lat=(52, 54), lon=(-12, -10), step=1):
    """Daily OISST v2.1 for a box and dates, saved to path, longitudes -180 to 180. CoastWatch's ERDDAP
    aggregation (version 2 before 2016, the same analysis as v2.1 for those years), with every day it
    lacks taken from NCEI's daily archive: the aggregations skip days, and a skipped day is silent."""
    path = Path(path)
    if not path.exists():
        days = pd.date_range(start, end)
        ds = "ncdcOisst2Agg" if days[-1].year <= 2015 else "ncdcOisst21Agg"
        a, b = lon[0] % 360, lon[1] % 360
        got = []
        for lo in [(a, b)] if a <= b else [(a, 359.875), (0.125, b)]:          # across 0°, two requests
            q = (f"{var}[({start}T12:00:00Z):1:({end}T12:00:00Z)][(0.0)]"
                 f"[({lat[0]}):{step}:({lat[1]})][({lo[0]}):{step}:({lo[1]})]")
            got.append(xr.open_dataset(io.BytesIO(_get(f"{CW}/{ds}.nc?{q}").content))[var].load())
        da = _lon180(xr.concat(got, "longitude").squeeze("zlev", drop=True))
        da = da.sel(time=slice(start, f"{end}T23:59"))                       # a missing end day snaps past it
        for day in days.difference(pd.DatetimeIndex(da.time.values).normalize()):
            url = f"{ARCHIVE}/{day:%Y%m}/oisst-avhrr-v02r01.{day:%Y%m%d}.nc"
            d = xr.open_dataset(io.BytesIO(_get(url).content))[var].squeeze("zlev", drop=True)
            d = _lon180(d.rename(lat="latitude", lon="longitude"))
            d = d.sel(latitude=da.latitude, longitude=da.longitude, method="nearest")
            da = xr.concat([da, d.assign_coords(latitude=da.latitude, longitude=da.longitude).load()], "time")
        da.sortby("time").to_dataset(name=var).to_netcdf(path)
    return xr.open_dataset(path)[var]
E = "https://coastwatch.pfeg.noaa.gov/erddap"
def get(dataset, query, path):
    p = Path("data", path)
    if not p.exists():
        p.write_bytes(requests.get(f"{E}/griddap/{dataset}.nc?{query}", timeout=900).content)
    return xr.open_dataset(p)
LAT, LON = (29.125, 60.875), (-60.875, 0.875)                                   # edges of the ERSST cells centred on 30-60 N, 60 W-0
oi = xr.Dataset({v: oisst("2023-06-01", "2023-06-30", f"data/oisst_natl_202306_ersstbox_{v}.nc", v, LAT, LON) for v in ("sst", "err")})
oisst_june = oi.sst.mean("time")
oisst_err = oi.err
er = get("nceiErsstv5_LonPM180", "sst[(2023-06-01T00:00:00Z)][(0.0)][(30):1:(60)][(-60):1:(0)]", "ersst_natl_202306.nc")
ersst_june = er.sst.squeeze(drop=True)
def meta(dataset, res):
    info = requests.get(f"{E}/info/{dataset}/index.json", timeout=120).json()["table"]["rows"]
    g = {r[2]: r[4] for r in info if r[0] == "attribute" and r[1] == "NC_GLOBAL"}
    return g | {"res": res}
OI_META, ER_META = meta("ncdcOisst21Agg", "day, 0.25°"), meta("nceiErsstv5_LonPM180", "month, 2°")
print(f"OISST June 2023: {oi.sizes['latitude']} x {oi.sizes['longitude']} cells x {oi.sizes['time']} days; ERSST: {er.sizes['latitude']} x {er.sizes['longitude']} cells")
OISST June 2023: 128 x 248 cells x 30 days; ERSST: 16 x 31 cells
The OISST request is 128 by 248 cells for each of 30 days, the ERSST one 16 by 31 cells for one month; the OISST box is drawn on the edges of the ERSST cells so that 8 by 8 OISST cells make up each ERSST cell exactly.
Example 1: the record each product can tell
Each product supports a different kind of question. Count what each offers for this region:
print(f"OISST: {OI_META['time_coverage_start'][:4]} onwards, daily, {oi.sizes['latitude'] * oi.sizes['longitude']:,} cells in this box")
print(f"ERSST: {ER_META['time_coverage_start'][:4]} onwards, monthly, {er.sizes['latitude'] * er.sizes['longitude']:,} cells in this box")
print(f"cells of OISST in one ERSST cell: {(2 / 0.25) ** 2:.0f}")
OISST: 1981 onwards, daily, 31,744 cells in this box
ERSST: 1854 onwards, monthly, 496 cells in this box
cells of OISST in one ERSST cell: 64
For this box, OISST offers 31,744 cells every day since 1981 and ERSST 496 cells every month since 1854; one ERSST cell covers 64 OISST cells.
The ocean's top metres are not one temperature
The ocean's top few metres are not one temperature. In sunshine and light wind the upper metre stratifies and the surface warms by a degree or more in the afternoon; at all times the top fraction of a millimetre, the skin, is a few tenths of a degree cooler than the water just below because it loses heat to the air. The Group for High Resolution SST names the layers: the skin, measured by infrared radiometers; the sub-skin, by microwave radiometers; SST at a depth, measured by buoys and ships; and the foundation temperature, below the reach of the daily cycle. Analyses such as OISST adjust satellite skin temperatures to in situ measurements at depth, so they estimate a bulk temperature of the upper metre or so, averaged over a day.
The products differ in what they trade. ERSST uses only ships, buoys and floats, reaches back to 1854, and fills its 2° monthly grid with statistical reconstruction where observations are sparse, which smooths out small features. OISST adds satellites from 1981, which resolves fronts and eddies daily, but inherits the satellites' gaps under clouds and their biases, corrected against the same in situ data ERSST uses. For long-term climate change ERSST is the backbone; for events, places and days OISST is the tool.
Higher resolution products and error fields
- Higher resolution products: NASA's MUR at 0.01° and the GHRSST Level 4 analyses resolve coastal features better, at the cost of large files and different blending choices.
- Ice: both products report SST under sea ice as a value near the freezing point, -1.8 °C, derived from ice concentration, not measured.
- Time stamps: on ERDDAP, ERSST months are labelled on the first of the month; OISST days at 12:00 UTC.
- Error fields: OISST's
erris a model estimate of the analysis error, useful for weighting and masking; it is not a measured difference from the truth.
Internal links
- How to download NOAA OISST sea surface temperature in Python — getting the daily product
- How to compare buoy water temperature with satellite SST in Python — a point against a cell
- How to compute an El Niño index in Python — an index built on ERSST
FAQ
What is the difference between skin and bulk sea surface temperature?
Skin temperature is the top fraction of a millimetre that infrared satellites see; bulk temperature is the water a metre or so down, measured by buoys. The skin is usually a few tenths of a degree cooler.
What is the difference between OISST and ERSST?
OISST blends satellite and in situ data daily at 0.25° from 1981; ERSST reconstructs monthly 2° fields from in situ data only, from 1854.
Which SST dataset should I use?
ERSST for long climate records and indices, OISST for daily events and regional detail, a higher-resolution analysis such as MUR for coastal work.
How accurate is satellite sea surface temperature?
OISST's own error estimate is typically a few tenths of a degree offshore and larger near coasts and ice; at buoys, daily differences are of the same order.