
How to Map Marine Heatwave Days in Python
On this page
Problem statement
In 2023 every one of the 2,070 half-degree ocean cells between 42° and 62° N in the north-east Atlantic spent some of the year in a marine heatwave, the average cell 131 days and the worst 337. A map like that needs a threshold for every cell and every day of the year — 365 seasonal 90th percentiles per cell from a 1991–2020 baseline — and runs of five or more days above it counted cell by cell, which is a NumPy problem of arrays rather than a pandas loop over one series.
This page computes the 1991–2020 threshold for every 0.5° cell of the north-east Atlantic from daily OISST with NumPy, counts the marine heatwave days of 2023 in each cell, maps them, and compares 2023 with the baseline years.
Quick answer
Build a day-of-year threshold array once, compare each day of the target year with it, and count days inside runs of five or more:
thresh = threshold(BASE, DOY_BASE)                                    # (365, lat, lon)
hot = Y23 > thresh[DOY_23 - 1]
days23 = mhw_days(hot)
w = np.cos(np.deg2rad(LATS))[:, None] * np.isfinite(days23)
print(f"cells: {np.isfinite(days23).sum():,}; mean marine heatwave days in 2023: {np.nansum(days23 * w) / w.sum():.0f}")
print(f"most: {np.nanmax(days23):.0f} days; cells with none: {int(np.nansum(days23 == 0))}")
cells: 2,070; mean marine heatwave days in 2023: 131
most: 337 days; cells with none: 0
Every one of the 2,070 ocean cells had marine heatwave days in 2023. Weighted by area, the average cell spent 131 days, more than a third of the year, in heatwave conditions, and the worst 337 days.
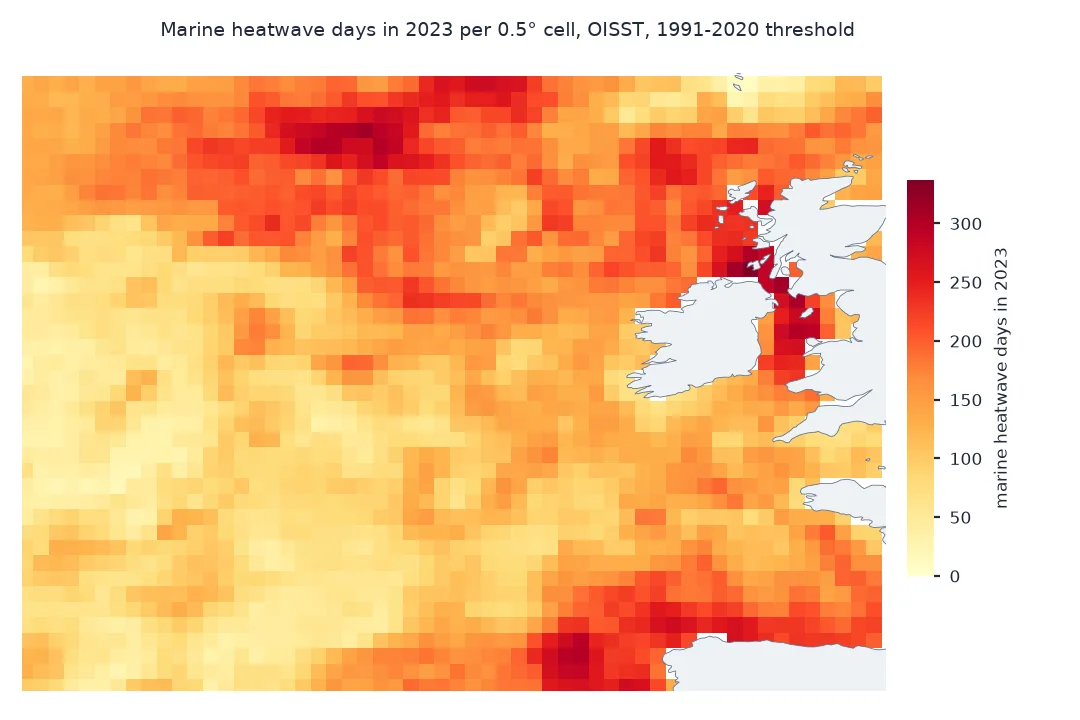
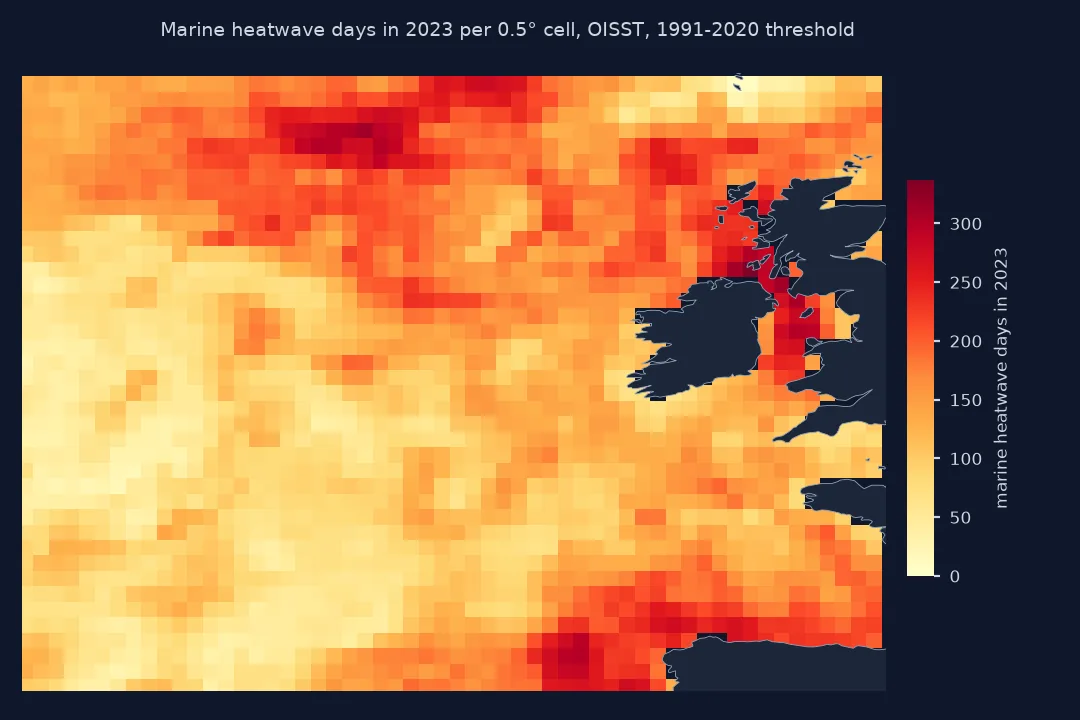
A threshold per cell and day, runs per cell, against the baseline
1. A threshold for every cell and day
For each day of the year, pool the baseline days within five days either side, take the 90th percentile in every cell at once, then smooth along the year with a 31-day circular running mean:
print(f"baseline array: {BASE.shape[0]:,} days x {BASE.shape[1]} x {BASE.shape[2]} cells, {BASE.nbytes / 1e6:.0f} MB")
print(f"threshold array: {thresh.shape}; threshold in the warmest month exceeds the coldest by a median of "
      f"{float(np.nanmedian(np.nanmax(thresh, 0) - np.nanmin(thresh, 0))):.1f} °C")
baseline array: 10,958 days x 40 x 56 cells, 98 MB
threshold array: (365, 40, 56); threshold in the warmest month exceeds the coldest by a median of 5.7 °C
The baseline is 10,958 days for 40 by 56 cells, 98 MB in memory. The threshold array has one field per day of the year; in the median cell the summer threshold is 5.7 °C above the winter one.
2. Runs, per cell
A day counts only if it belongs to a run of at least five hot days, with gaps of two days or less joined. Do it per cell on the boolean array:
print(f"hot days in 2023, all cells: {int(hot.sum()):,}; of those inside heatwaves: {int(np.nansum(days23)):,} ({np.nansum(days23) / hot.sum():.0%})")
print(f"median cell: {np.nanmedian(days23):.0f} days; 90th percentile cell: {np.nanpercentile(days23, 90):.0f} days")
hot days in 2023, all cells: 297,235; of those inside heatwaves: 276,850 (93%)
median cell: 130 days; 90th percentile cell: 216 days
Of 297,235 cell-days above the threshold in 2023, 93% were inside events of five days or more: the warm days came in long spells, not scattered. The median cell had 130 heatwave days, and one in ten cells more than 216.
3. Against the baseline
By construction, about 10% of baseline days are above the threshold, but fewer are inside five-day runs. Count heatwave days in every baseline year with the same code and compare:
per_year = []
for y in range(1991, 2021):
    sel = YEARS_BASE == y
    per_year.append(np.nanmean(mhw_days(BASE[sel] > thresh[DOY_BASE[sel] - 1])))
per_year = pd.Series(per_year, index=range(1991, 2021))
print(f"baseline mean: {per_year.mean():.0f} days per cell per year; most in {per_year.idxmax()}: {per_year.max():.0f}; 2023: {np.nanmean(days23):.0f}")
baseline mean: 25 days per cell per year; most in 2007: 71; 2023: 134
In the baseline years the average cell had 25 heatwave days a year, at most 71 in 2007. 2023, at 134 days in the same unweighted average, is more than five times the baseline average and almost twice the highest baseline year.
Where 2023 stood out most
The data used on this page
Daily NOAA OISST for 1991–2020 and 2023, 42°N to 62°N and 30°W to 2°W, at every second 0.25° cell (0.5°). Each year comes from NOAA CoastWatch's ERDDAP — version 2 to 2015, v2.1 after — with every day it lacks filled from NCEI's daily files, as in the marine heatwave guide. The definition follows Hobday et al. (2016).
import io
import time
from pathlib import Path

import numpy as np
import pandas as pd
import requests
import xarray as xr

Path("data").mkdir(exist_ok=True)
CW = "https://coastwatch.pfeg.noaa.gov/erddap/griddap"
ARCHIVE = "https://www.ncei.noaa.gov/data/sea-surface-temperature-optimum-interpolation/v2.1/access/avhrr"
def _get(url):
    for attempt in range(5):                                            # a busy ERDDAP answers 500 or 503
        r = requests.get(url, timeout=900)
        if r.status_code < 500:
            break
        time.sleep(30 * (attempt + 1))
    r.raise_for_status()
    return r
def _lon180(da):
    return da.assign_coords(longitude=(da.longitude + 180) % 360 - 180).sortby("longitude")
def oisst(start, end, path, var="sst", lat=(52, 54), lon=(-12, -10), step=1):
    """Daily OISST v2.1 for a box and dates, saved to path, longitudes -180 to 180. CoastWatch's ERDDAP
    aggregation (version 2 before 2016, the same analysis as v2.1 for those years), with every day it
    lacks taken from NCEI's daily archive: the aggregations skip days, and a skipped day is silent."""
    path = Path(path)
    if not path.exists():
        days = pd.date_range(start, end)
        ds = "ncdcOisst2Agg" if days[-1].year <= 2015 else "ncdcOisst21Agg"
        a, b = lon[0] % 360, lon[1] % 360
        got = []
        for lo in [(a, b)] if a <= b else [(a, 359.875), (0.125, b)]:          # across 0°, two requests
            q = (f"{var}[({start}T12:00:00Z):1:({end}T12:00:00Z)][(0.0)]"
                 f"[({lat[0]}):{step}:({lat[1]})][({lo[0]}):{step}:({lo[1]})]")
            got.append(xr.open_dataset(io.BytesIO(_get(f"{CW}/{ds}.nc?{q}").content))[var].load())
        da = _lon180(xr.concat(got, "longitude").squeeze("zlev", drop=True))
        da = da.sel(time=slice(start, f"{end}T23:59"))                       # a missing end day snaps past it
        for day in days.difference(pd.DatetimeIndex(da.time.values).normalize()):
            url = f"{ARCHIVE}/{day:%Y%m}/oisst-avhrr-v02r01.{day:%Y%m%d}.nc"
            d = xr.open_dataset(io.BytesIO(_get(url).content))[var].squeeze("zlev", drop=True)
            d = _lon180(d.rename(lat="latitude", lon="longitude"))
            d = d.sel(latitude=da.latitude, longitude=da.longitude, method="nearest")
            da = xr.concat([da, d.assign_coords(latitude=da.latitude, longitude=da.longitude).load()], "time")
        da.sortby("time").to_dataset(name=var).to_netcdf(path)
    return xr.open_dataset(path)[var]
def year(y, lat=(42.125, 61.875), lon=(-29.875, -2.125)):
    return oisst(f"{y}-01-01", f"{y}-12-31", f"data/oisst_neatl_halfdeg_{y}.nc", "sst", lat, lon, step=2)
def doy365(t):
    t = pd.DatetimeIndex(t)
    d = t.dayofyear - ((t.is_leap_year) & (t.dayofyear > 59)).astype(int)
    return np.where((t.month == 2) & (t.day == 29), 59, d)
base = xr.concat([year(y) for y in range(1991, 2021)], "time")
BASE, DOY_BASE, YEARS_BASE = base.values, doy365(base.time.values), pd.DatetimeIndex(base.time.values).year.values
y23 = year(2023)
Y23, DOY_23, LATS = y23.values, doy365(y23.time.values), y23.latitude.values
missing = 10958 - len(DOY_BASE)                                                  # days in 1991-2020
assert missing == 0 and len(DOY_23) == 365, f"{missing} baseline days missing"
def threshold(x, doy, window=5, smooth=31):
    out = np.empty((365,) + x.shape[1:], dtype="float32")
    for k in range(1, 366):
        near = np.isin(doy, [(k + o - 1) % 365 + 1 for o in range(-window, window + 1)])
        out[k - 1] = np.nanpercentile(x[near], 90, axis=0)
    pad = np.concatenate([out[-smooth:], out, out[:smooth]])
    kernel = np.ones(smooth) / smooth
    sm = np.apply_along_axis(lambda v: np.convolve(v, kernel, "same"), 0, pad)
    return sm[smooth:-smooth]
def mhw_days(hot, min_days=5, max_gap=2):
    """Days inside marine heatwaves for each cell of a (day, lat, lon) boolean array; NaN where the cell is land."""
    out = np.full(hot.shape[1:], np.nan)
    land = np.isnan(BASE[0])
    for i, j in zip(*np.nonzero(~land)):
        h = hot[:, i, j]
        idx = np.flatnonzero(np.diff(np.r_[0, h.astype(int), 0]))
        runs = [(a, b) for a, b in zip(idx[::2], idx[1::2]) if b - a >= min_days]
        joined = []
        for a, b in runs:
            if joined and a - joined[-1][1] <= max_gap:
                joined[-1] = (joined[-1][0], b)
            else:
                joined.append((a, b))
        out[i, j] = sum(b - a for a, b in joined)
    return out
print(f"grid {len(LATS)} x {y23.sizes['longitude']} at 0.5°; baseline {len(DOY_BASE):,} days ({missing} missing); 2023 {len(DOY_23)} days")
grid 40 x 56 at 0.5°; baseline 10,958 days (0 missing); 2023 365 days
The grid is 40 by 56 cells of 0.5°. No day is missing: the two days of 2011 that CoastWatch's version 2 aggregation lacks came from NCEI's daily files, and 2023 is complete.
Example 1: where 2023 stood out most
Express each cell's 2023 total as a multiple of its own baseline average, and list the places furthest above normal:
base_mean = np.mean([mhw_days(BASE[YEARS_BASE == y] > thresh[DOY_BASE[YEARS_BASE == y] - 1]) for y in range(1991, 2021)], axis=0)
ratio = days23 / np.where(base_mean > 0, base_mean, np.nan)
print(f"cells where 2023 had at least three times the baseline average: {int(np.nansum(ratio >= 3)):,} of {np.isfinite(ratio).sum():,}")
for name, (la, lo) in {"west of Ireland": (53.0, -12.0), "Celtic Sea": (50.5, -7.5), "Bay of Biscay": (45.5, -4.5), "south of Iceland": (61.0, -20.0)}.items():
    i, j = np.argmin(abs(LATS - la)), np.argmin(abs(y23.longitude.values - lo))
    print(f"{name:>17}: {days23[i, j]:.0f} days in 2023, baseline average {base_mean[i, j]:.1f}")
cells where 2023 had at least three times the baseline average: 1,617 of 2,070
west of Ireland: 147 days in 2023, baseline average 25.5
Celtic Sea: 125 days in 2023, baseline average 23.4
Bay of Biscay: 161 days in 2023, baseline average 22.8
south of Iceland: 203 days in 2023, baseline average 26.8
In 1,617 of 2,070 cells, 78%, 2023 had at least three times the baseline average. West of Ireland had 147 days against a baseline of 25.5, the Bay of Biscay 161 against 22.8, and the water south of Iceland 203 against 26.8.
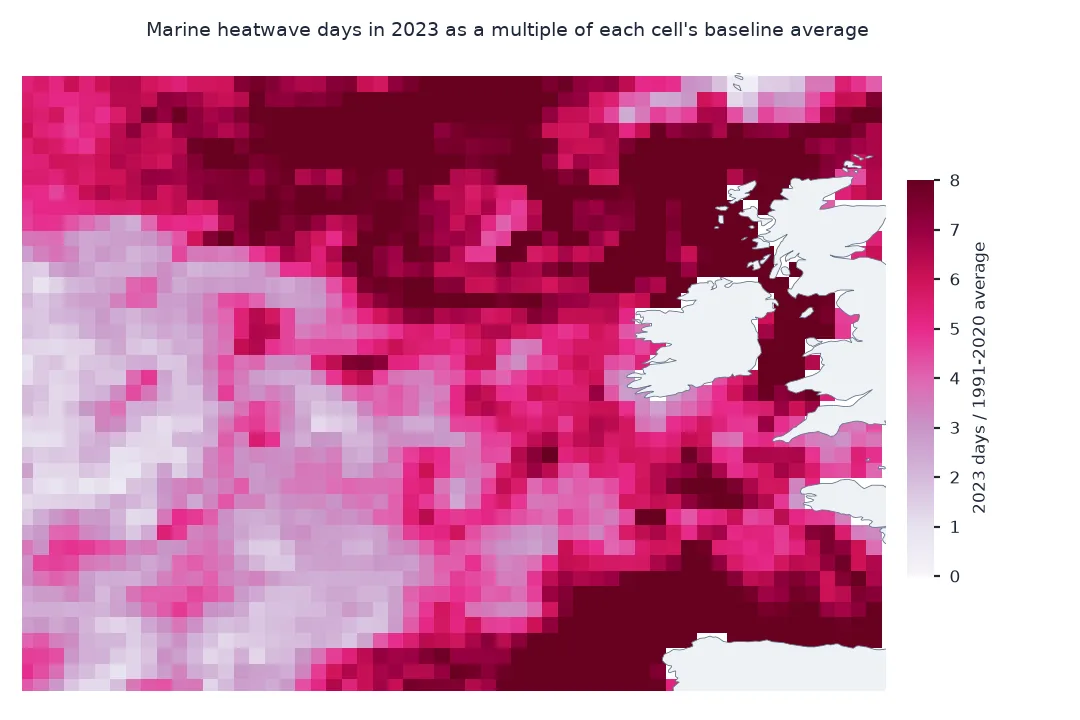
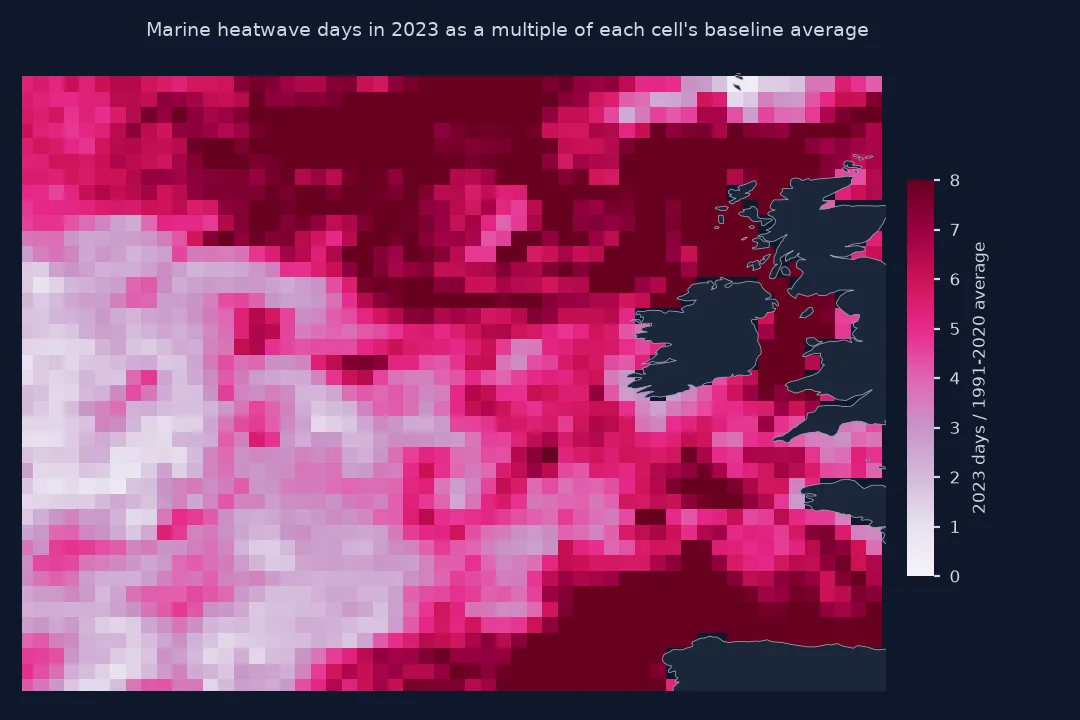
Each cell judged against its own climate
Mapping marine heatwaves cell by cell keeps the definition local: each cell is compared with its own seasonal cycle and its own variability, so a heatwave in the Bay of Biscay and one south of Iceland are both departures from what is normal there, not from a basin-wide average. The cost is computation: a day-of-year percentile for every cell is a 365-step loop over arrays of several hundred days, which NumPy does in seconds for a few thousand cells, and run detection is a loop over cells, each a short scan.
Heatwave days per year is the simplest map, but it compresses the information. A cell with one 60-day event and a cell with six 10-day events both show 60 days. Maps of the number of events, the longest event, or the peak intensity tell the difference, and the same arrays produce them. And because the threshold is fixed to 1991–2020, a warming trend shows up as more heatwave days everywhere; a detrended or moving baseline would instead highlight departures from the recent normal.
Resolution, run lengths and year boundaries
- Resolution: every second cell gives a 0.5° sample of the 0.25° grid; at full resolution the arrays are four times larger and coastal cells are better represented.
- Run length per cell: the five-day rule is applied in time only; neighbouring cells can belong to the same event without being linked.
- Year boundaries: events that start in late December are cut at 1 January when counting one year; join the years first if events crossing the year matter.
- Missing days: the setup checks the day counts, because a missing day breaks runs; see the missing days fix.
Internal links
- How to detect marine heatwaves in Python — the same method on one series
- How to map sea surface temperature anomalies in Python — anomalies, the step before events
- Marine heatwaves explained — definition and categories
FAQ
How do I map marine heatwaves in Python?
Compute a day-of-year 90th percentile threshold for every grid cell from a 30-year baseline, flag days above it, and count days in runs of at least five, cell by cell.
How many marine heatwave days are normal?
In the 1991–2020 baseline for this region, the average cell has the number of heatwave days per year printed in step 3; fewer than the 10% of days above the threshold, because short warm spells do not count.
Why use a 0.5 degree grid?
To keep the download and arrays small for a regional map; the method works the same at 0.25°.
Can I use the marineHeatWaves package for maps?
Yes, by looping it over cells; the vectorised threshold here is much faster for thousands of cells.