
Fixing Sea Surface Temperature Anomalies That Disagree Between Sources
On this page
Problem statement
Two sea surface temperature anomalies for the same place and day disagree by half a degree or more. One comes from the anom variable that ships with OISST, the other from a climatology computed from OISST itself, or from a news release, a different dataset or a colleague's notebook. Both can be correct. An anomaly is a temperature minus a "normal", and the normal depends on the base period and on the data it was built from: OISST's own anomalies are relative to a 1971–2000 climatology interpolated from monthly 1° fields, while most current work uses 1991–2020, a period three decades later and, in a warming ocean, usually warmer.
This page measures the gap for a box off the west coast of Ireland, shows how it changes through the year and what it does to a count of unusually warm days, and converts anomalies from one baseline to the other.
Quick answer
Compute your own climatology for the baseline you want, and never mix anomalies from different baselines:
own = T - clim91                                                          # anomaly against 1991-2020
day = pd.Timestamp("2023-06-21")
print(f"21 June 2023: SST {T[day]:.2f} °C; OISST anom (1971-2000) {A[day]:+.2f} °C; against 1991-2020 {own[day]:+.2f} °C")
print(f"difference: {A[day] - own[day]:.2f} °C")
21 June 2023: SST 17.54 °C; OISST anom (1971-2000) +4.30 °C; against 1991-2020 +3.74 °C
difference: 0.56 °C
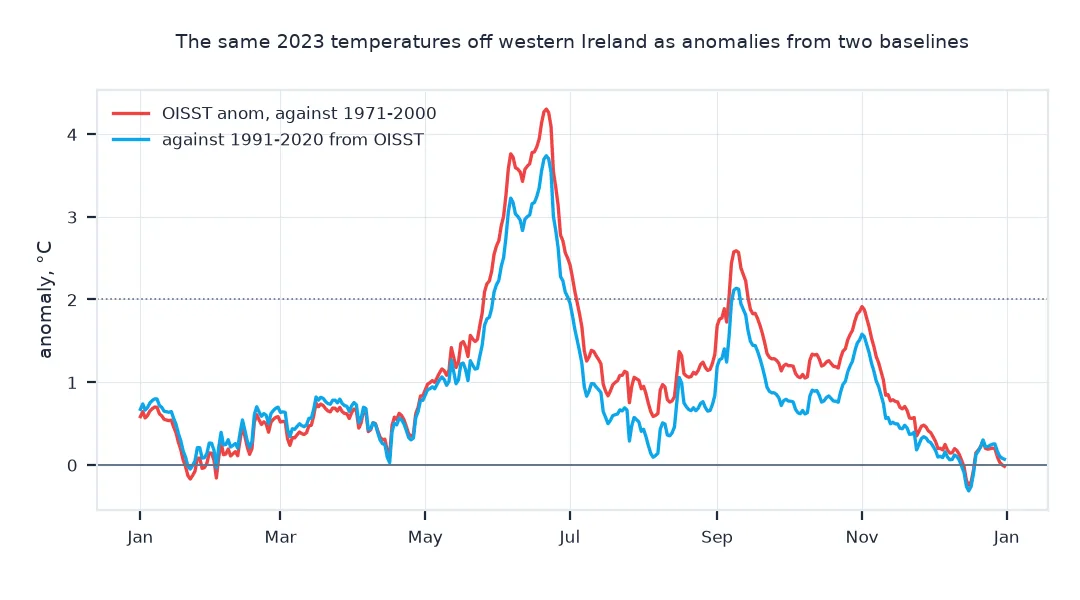
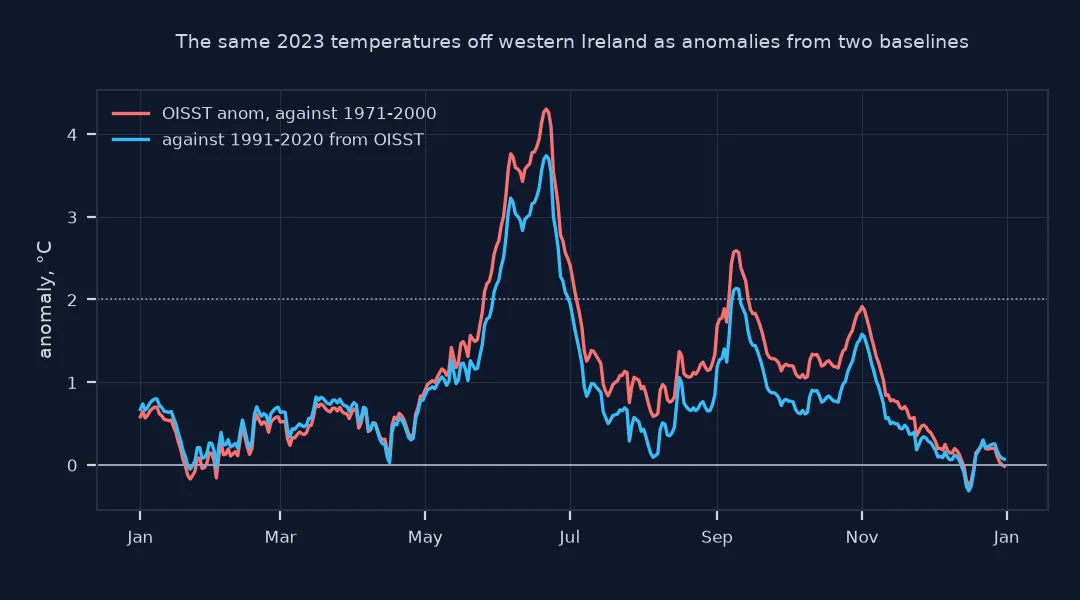
On 21 June 2023 the box was 17.54 °C. Against OISST's own 1971–2000 normal that is 4.30 °C above normal; against a 1991–2020 normal from OISST itself, 3.74 °C. Same water, same day, 0.56 °C apart.
Recover the climatology, see the count change, convert baselines
1. Recover the climatology behind anom
The temperature minus its anomaly is the climatology the anomaly was computed from. Compare it, month by month, with a 1991–2020 climatology computed from OISST itself:
implied = (T - A)["2023"]
gap = (clim91["2023"] - implied)
print(gap.groupby(gap.index.month).mean().round(2).rename("1991-2020 minus 1971-2000, °C").to_string())
print(f"annual mean gap: {gap.mean():.2f} °C; range {gap.min():.2f} to {gap.max():.2f} °C")
time
1 -0.11
2 -0.10
3 -0.10
4 0.02
5 0.24
6 0.55
7 0.42
8 0.44
9 0.43
10 0.42
11 0.24
12 0.03
annual mean gap: 0.21 °C; range -0.13 to 0.62 °C
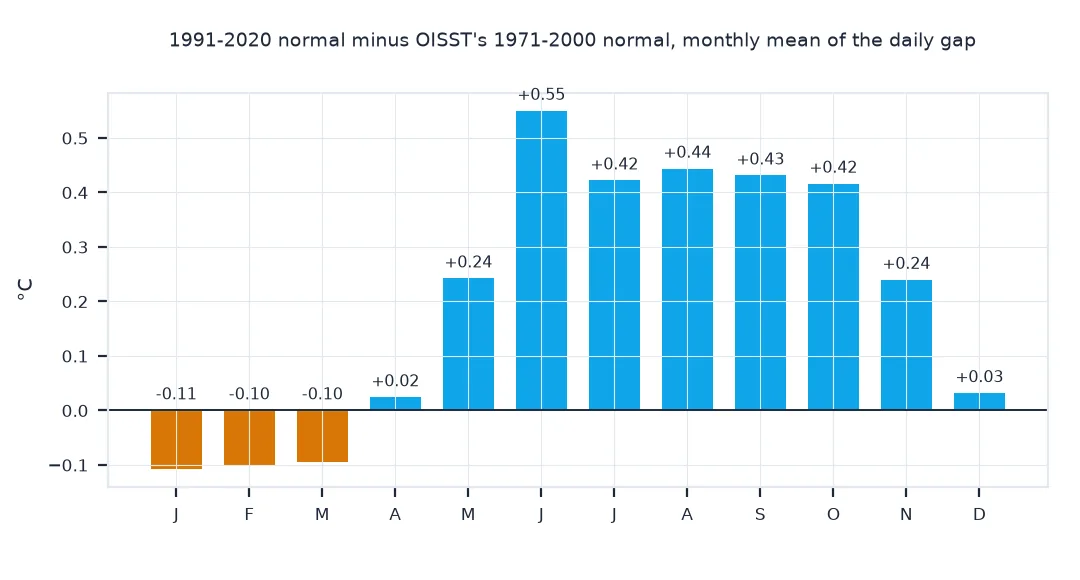
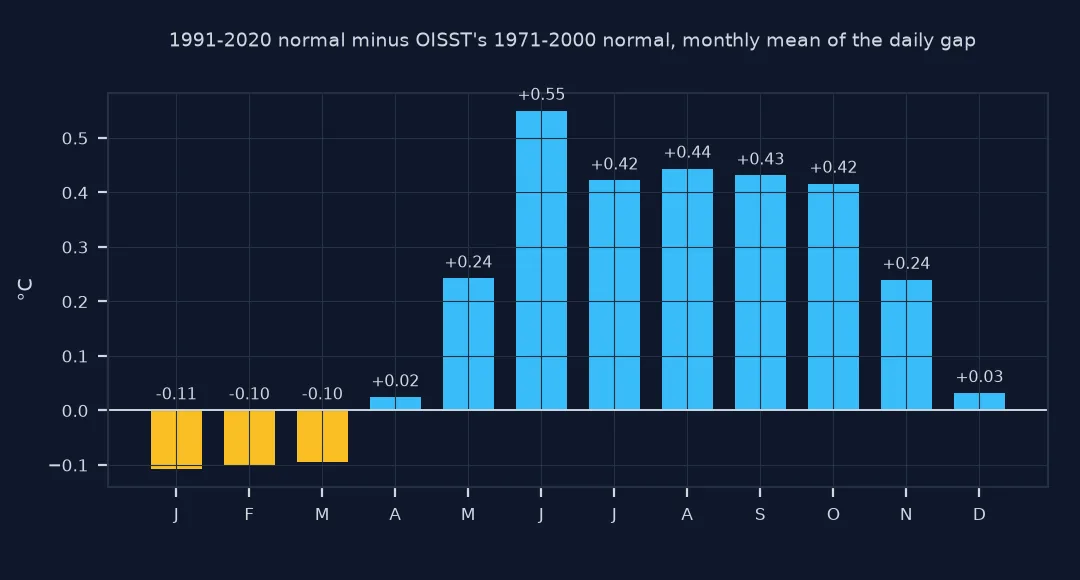
The gap is not constant. From May to November the 1991–2020 normal is warmer, by up to 0.55 °C in June; from December to March it is slightly cooler, by about 0.1 °C. Over the year the 1991–2020 normal is 0.21 °C warmer on average, but the daily gap ranges from -0.13 to +0.62 °C. The summer gap fits a warming ocean; a cooler late-winter normal three decades later does not, and points to differences between the climatologies themselves, the older one interpolated from monthly 1° fields of an earlier analysis.
2. What the baseline does to a count
Count the days in 2023 more than 1 °C and more than 2 °C above normal under each baseline:
for thr in (1, 2):
    a, b = int((A["2023"] > thr).sum()), int((own["2023"] > thr).sum())
    print(f"days more than {thr} °C above normal in 2023: {a} against 1971-2000, {b} against 1991-2020")
days more than 1 °C above normal in 2023: 167 against 1971-2000, 95 against 1991-2020
days more than 2 °C above normal in 2023: 48 against 1971-2000, 35 against 1991-2020
The baseline almost halves the count of warm days: 167 days more than 1 °C above normal against 1971–2000, 95 against 1991–2020. A report of "days above normal" means little without its base period.
3. Converting between baselines
An anomaly against one baseline becomes an anomaly against another by subtracting the difference between the two climatologies, day by day. A single annual offset is a rougher approximation:
exact = A - (clim91 - (T - A))
rough = A - gap.mean()
print(f"exact conversion, largest difference from own anomaly: {float((exact - own)['2023'].abs().max()):.6f} °C")
print(f"single offset of {gap.mean():.2f} °C: error up to {float((rough - own)['2023'].abs().max()):.2f} °C")
exact conversion, largest difference from own anomaly: 0.000000 °C
single offset of 0.21 °C: error up to 0.41 °C
Subtracting the difference between the two climatologies day by day converts one anomaly into the other exactly. A single annual offset gets individual days wrong by up to 0.41 °C, because the gap changes with the season.
2023 anomalies under both baselines
The data used on this page
Daily NOAA OISST sst for 1991–2020 and 2023 and anom for 2023, for 52°N to 54°N and 12°W to 10°W, averaged over the box with cosine-of-latitude weights; each year comes from NOAA CoastWatch's ERDDAP with every day it lacks filled from NCEI's daily files, as in the marine heatwave guide. NCEI's OISST FAQ states that the daily anomalies use a climatology for the 1971–2000 base period, interpolated to the daily 0.25° grid from a monthly 1° file (Xue et al., 2003).
import io
import time
from pathlib import Path

import numpy as np
import pandas as pd
import requests
import xarray as xr

Path("data").mkdir(exist_ok=True)
CW = "https://coastwatch.pfeg.noaa.gov/erddap/griddap"
ARCHIVE = "https://www.ncei.noaa.gov/data/sea-surface-temperature-optimum-interpolation/v2.1/access/avhrr"
def _get(url):
    for attempt in range(5):                                            # a busy ERDDAP answers 500 or 503
        r = requests.get(url, timeout=900)
        if r.status_code < 500:
            break
        time.sleep(30 * (attempt + 1))
    r.raise_for_status()
    return r
def _lon180(da):
    return da.assign_coords(longitude=(da.longitude + 180) % 360 - 180).sortby("longitude")
def oisst(start, end, path, var="sst", lat=(52, 54), lon=(-12, -10), step=1):
    """Daily OISST v2.1 for a box and dates, saved to path, longitudes -180 to 180. CoastWatch's ERDDAP
    aggregation (version 2 before 2016, the same analysis as v2.1 for those years), with every day it
    lacks taken from NCEI's daily archive: the aggregations skip days, and a skipped day is silent."""
    path = Path(path)
    if not path.exists():
        days = pd.date_range(start, end)
        ds = "ncdcOisst2Agg" if days[-1].year <= 2015 else "ncdcOisst21Agg"
        a, b = lon[0] % 360, lon[1] % 360
        got = []
        for lo in [(a, b)] if a <= b else [(a, 359.875), (0.125, b)]:          # across 0°, two requests
            q = (f"{var}[({start}T12:00:00Z):1:({end}T12:00:00Z)][(0.0)]"
                 f"[({lat[0]}):{step}:({lat[1]})][({lo[0]}):{step}:({lo[1]})]")
            got.append(xr.open_dataset(io.BytesIO(_get(f"{CW}/{ds}.nc?{q}").content))[var].load())
        da = _lon180(xr.concat(got, "longitude").squeeze("zlev", drop=True))
        da = da.sel(time=slice(start, f"{end}T23:59"))                       # a missing end day snaps past it
        for day in days.difference(pd.DatetimeIndex(da.time.values).normalize()):
            url = f"{ARCHIVE}/{day:%Y%m}/oisst-avhrr-v02r01.{day:%Y%m%d}.nc"
            d = xr.open_dataset(io.BytesIO(_get(url).content))[var].squeeze("zlev", drop=True)
            d = _lon180(d.rename(lat="latitude", lon="longitude"))
            d = d.sel(latitude=da.latitude, longitude=da.longitude, method="nearest")
            da = xr.concat([da, d.assign_coords(latitude=da.latitude, longitude=da.longitude).load()], "time")
        da.sortby("time").to_dataset(name=var).to_netcdf(path)
    return xr.open_dataset(path)[var]
def fetch(var, year, lat=(52, 54), lon=(-12, -10), tag="ireland_west"):
    """Box mean of one OISST variable for one year, weighted by cos(latitude)."""
    da = oisst(f"{year}-01-01", f"{year}-12-31", f"data/oisst_{tag}_{var}_{year}.nc", var, lat, lon)
    s = da.weighted(np.cos(np.deg2rad(da.latitude))).mean(["latitude", "longitude"]).to_series()
    s.index = s.index.normalize()
    return s
T = pd.concat([fetch("sst", y) for y in list(range(1991, 2021)) + [2023]])
A = fetch("anom", 2023)
def doy365(idx):
    d = idx.dayofyear - ((idx.is_leap_year) & (idx.dayofyear > 59)).astype(int)
    return np.where((idx.month == 2) & (idx.day == 29), 59, d)
base = T["1991":"2020"]
c = pd.Series(base.values, index=doy365(base.index)).groupby(level=0).mean()
c = pd.concat([c.iloc[-15:], c, c.iloc[:15]]).rolling(31, center=True).mean().iloc[15:-15]       # smooth the daily means
clim91 = pd.Series(c.loc[doy365(T.index)].values, index=T.index)
print(f"{len(T):,} days of SST, {len(A)} days of anom; 1991-2020 climatology from {len(base):,} days (expected {(pd.Timestamp('2021-01-01') - pd.Timestamp('1991-01-01')).days:,})")
11,323 days of SST, 365 days of anom; 1991-2020 climatology from 10,958 days (expected 10,958)
The series has 11,323 days of SST, from 1991–2020 and 2023, and 365 days of anom for 2023. The 1991–2020 climatology rests on all 10,958 days.
Example 1: monthly anomalies for 2023 under both baselines
A monthly table makes the offset obvious, and shows it is not constant:
M = pd.DataFrame({"against 1971-2000": A.resample("MS").mean(), "against 1991-2020": own["2023"].resample("MS").mean()})
M["gap"] = M.iloc[:, 0] - M.iloc[:, 1]
M.index = M.index.strftime("%b")
print(M.round(2).to_string())
against 1971-2000 against 1991-2020 gap
time
Jan 0.31 0.42 -0.11
Feb 0.31 0.41 -0.10
Mar 0.54 0.64 -0.10
Apr 0.50 0.47 0.02
May 1.49 1.24 0.24
Jun 3.50 2.95 0.55
Jul 1.27 0.85 0.42
Aug 1.00 0.55 0.44
Sep 1.78 1.35 0.43
Oct 1.30 0.89 0.42
Nov 0.90 0.66 0.24
Dec 0.12 0.09 0.03
June 2023 was 3.50 °C above the 1971–2000 normal and 2.95 °C above 1991–2020. In January to March the order reverses, which a single conversion factor would hide.
What makes two climatologies differ
A climatology is the expected temperature for each day of the year, averaged over a base period. Three things make two climatologies differ. The base period: the ocean has warmed, so a later period has warmer normals and smaller anomalies. The data: OISST's 1971–2000 climatology predates OISST itself, which starts in 1981, so it was built from an earlier analysis and interpolated from monthly 1° fields; a climatology computed from daily OISST has finer detail. And the method: how the daily means are smoothed changes the shape of the seasonal cycle, especially around its peaks.
None of these makes one anomaly wrong; it makes them answer different questions. Anomalies against 1971–2000 show how far today is from a late-20th-century ocean; against 1991–2020, how far it is from the recent normal, which is what the World Meteorological Organization recommends for describing current conditions. What matters is to say which, and to compare only anomalies with the same baseline.
Other products, leap days and smoothing
- Other products: ERSST and the Climate Prediction Center's indices use their own base periods, and the Oceanic Niño Index uses a sliding 30-year base updated every five years; check each source's documentation.
- PSL climatologies: NOAA PSL publishes a 1991–2020 daily OISST climatology file (
sst.day.mean.ltm.1991-2020.nc), which saves computing one but is global and large. - Leap days: build the climatology on a 365-day calendar, or 29 February gets its own noisy normal from seven or eight values.
- Smoothing: an unsmoothed daily mean from 30 years has visible noise; a 31-day running mean, as here, is a common choice.
Internal links
- How to download NOAA OISST sea surface temperature in Python — where
anomcomes from - How to detect marine heatwaves in Python — a method that needs a stated baseline
- How to map sea surface temperature anomalies in Python — anomalies in space
FAQ
What baseline does OISST use for anomalies?
The anom variable in OISST v2.1 is relative to a 1971–2000 climatology, according to NCEI's documentation.
Why do two SST anomaly values for the same day differ?
Usually because they use different base periods, such as 1971–2000 and 1991–2020, or climatologies built from different data; in summer and autumn off western Ireland the 1991–2020 normal is warmer and its anomalies smaller, in late winter the reverse.
How do I convert SST anomalies to a different baseline?
Subtract the difference between the two climatologies for each day of the year; a single annual offset is only an approximation.
Which baseline should I use?
1991–2020 for describing current conditions, as the WMO recommends; whichever you use, state it and keep it consistent.