
Fixing Empty SST Selections on Grids with 0–360 Longitudes
On this page
Problem statement
A sea surface temperature file opens fine, but selecting the Atlantic off Ireland with sel(lon=slice(-12, -10)) returns an empty array, or a map of the North Atlantic shows only the part east of Greenwich. Global ocean products, including NOAA's OISST files from NCEI and its aggregation on NOAA CoastWatch's ERDDAP server, store longitude from 0 to 360 degrees east, so 12°W is 348°E, and a box that crosses the prime meridian is two pieces at opposite ends of the array.
This page reproduces the empty selection on a raw OISST file, converts the coordinates to -180 to 180, selects a box across 0°, and shows the equivalent request on an ERDDAP server that uses 0–360.
Quick answer
Convert the coordinate, sort, and then select with ordinary western longitudes:
print(f"longitudes run from {float(ds.lon.min())} to {float(ds.lon.max())}; selecting -12 to -10 gives {ds.sel(lon=slice(-12, -10)).sizes['lon']} columns")
ds180 = ds.assign_coords(lon=(ds.lon + 180) % 360 - 180).sortby("lon")
box = ds180.sst.sel(lat=slice(52, 54), lon=slice(-12, -10))
print(f"after conversion: {box.sizes['lon']} columns from {float(box.lon.min())} to {float(box.lon.max())}; mean {float(box.mean()):.2f} °C")
longitudes run from 0.125 to 359.875; selecting -12 to -10 gives 0 columns
after conversion: 8 columns from -11.875 to -10.125; mean 17.62 °C
The grid's longitudes run from 0.125 to 359.875, so asking for -12 to -10 returns no columns at all, silently. After the conversion the same request returns the 8 columns from 11.875°W to 10.125°W, with a mean of 17.62 °C.
Why the selection was empty, prime meridian boxes, server requests
1. Why the selection was empty
slice(-12, -10) asks for coordinates between -12 and -10. None exist in a 0–360 grid, so xarray returns zero columns without complaint:
print(f"first and last longitudes: {ds.lon.values[:3]} ... {ds.lon.values[-3:]}")
print(f"12°W in this grid is {-12 % 360}°E; cells between 348 and 350: {ds.sel(lon=slice(348, 350)).sizes['lon']}")
first and last longitudes: [0.125 0.375 0.625] ... [359.375 359.625 359.875]
12°W in this grid is 348°E; cells between 348 and 350: 8
In the original grid, 12°W is 348°E, and the 8 cells between 348 and 350 are the right ones.
2. A box across the prime meridian
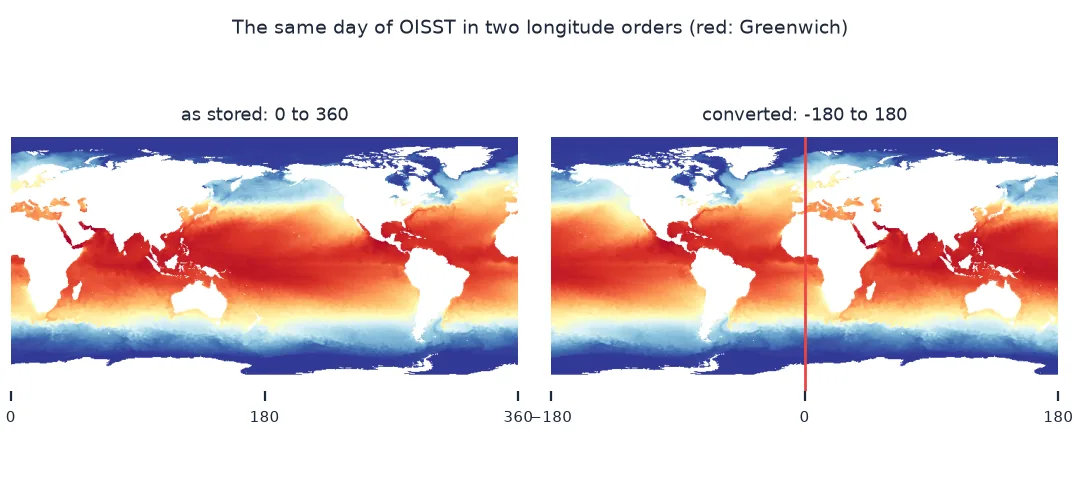
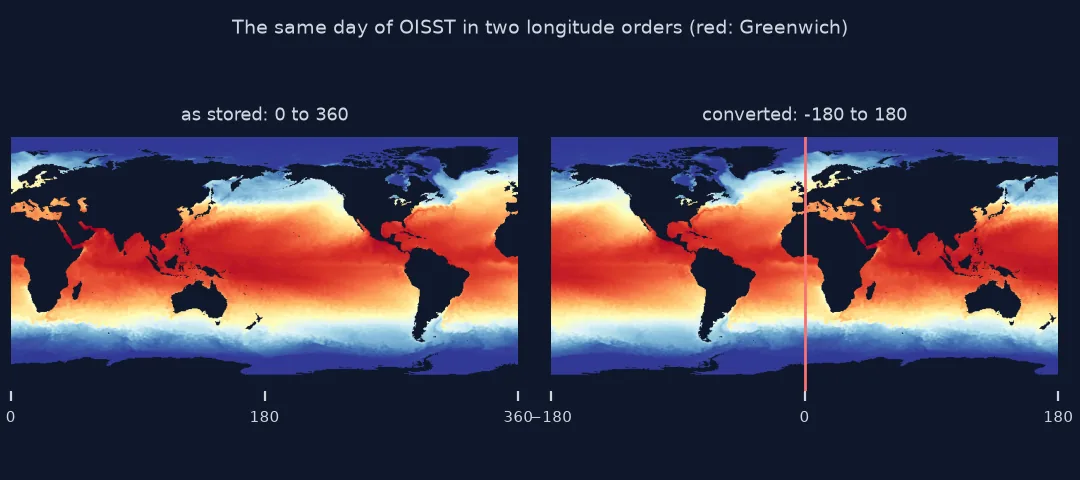
A box from 10°W to 10°E is one slice after conversion, but two in the original grid, at its two ends:
a = ds.sst.sel(lat=slice(48, 52), lon=slice(350, 360))
b = ds.sst.sel(lat=slice(48, 52), lon=slice(0, 10))
joined = xr.concat([a.assign_coords(lon=a.lon - 360), b], "lon")
direct = ds180.sst.sel(lat=slice(48, 52), lon=slice(-10, 10))
print(f"two pieces: {a.sizes['lon']} + {b.sizes['lon']} columns; converted grid: {direct.sizes['lon']} columns; identical: {bool((joined.values == direct.values)[~np.isnan(direct.values)].all())}")
print(f"naive slice(350, 10) on the original grid: {ds.sel(lon=slice(350, 10)).sizes['lon']} columns")
two pieces: 40 + 40 columns; converted grid: 80 columns; identical: True
naive slice(350, 10) on the original grid: 0 columns
On the original grid the box from 10°W to 10°E is two pieces of 40 columns at opposite ends of the array; joined, they equal the 80 columns of the converted grid exactly. Asking for 350 to 10 in one slice returns nothing, because the start is larger than the stop.
3. Requests to a 0–360 server
ERDDAP passes longitudes through as the dataset stores them. CoastWatch's OISST v2.1 aggregation, ncdcOisst21Agg, uses 0–360, so a request with -12 to -10 fails, and 348 to 350 works:
url = "https://coastwatch.pfeg.noaa.gov/erddap/griddap/ncdcOisst21Agg.nc?sst[(2023-06-21T12:00:00Z)][(0.0)][(52):1:(54)]"
bad = requests.get(url + "[(-12):1:(-10)]", timeout=300)
good = requests.get(url + "[(348):1:(350)]", timeout=300)
print(f"-12 to -10: HTTP {bad.status_code}: {bad.text.split('message=')[-1][:90].strip() if bad.status_code != 200 else 'ok'}")
Path("data/erddap_box.nc").write_bytes(good.content)
g = xr.open_dataset("data/erddap_box.nc").sst.squeeze()
print(f"348 to 350: HTTP {good.status_code}, {g.sizes['longitude']} columns, mean {float(g.mean()):.2f} °C")
-12 to -10: HTTP 404: "Not Found: Your query produced no matching results. Query error: For variable=sst axis#3=
348 to 350: HTTP 200, 9 columns, mean 17.54 °C
The server answers a request for -12 to -10 with HTTP 404 and an error naming the longitude axis; 348 to 350 works. ERDDAP snaps each end to the nearest cell centre, so it returns 9 columns, one more than the file selection above, and a mean of 17.54 °C.
Plotting without a seam
The data used on this page
The NOAA OISST v2.1 daily file for 21 June 2023 from NCEI's data archive, and the same day from NOAA CoastWatch's ERDDAP.
from pathlib import Path

import numpy as np
import requests
import xarray as xr

Path("data").mkdir(exist_ok=True)
p = Path("data/oisst-avhrr-v02r01.20230621.nc")
if not p.exists():
    p.write_bytes(requests.get("https://www.ncei.noaa.gov/data/sea-surface-temperature-optimum-interpolation/v2.1/access/avhrr/"
                               "202306/oisst-avhrr-v02r01.20230621.nc", timeout=300).content)
ds = xr.open_dataset(p).squeeze(["time", "zlev"], drop=True)
print(f"{p.name}: {p.stat().st_size / 1e6:.1f} MB; grid {ds.sizes['lat']} x {ds.sizes['lon']}; variables {list(ds.data_vars)}")
oisst-avhrr-v02r01.20230621.nc: 1.5 MB; grid 720 x 1440; variables ['sst', 'anom', 'err', 'ice']
The daily file is 1.5 MB, a 720 by 1,440 global grid with four variables.
Example 1: plot without a seam
Plotting the original grid centred on the Atlantic puts a seam at 0°; the converted, sorted grid plots continuously. Check what each would draw for a strip along 50°N:
row0 = ds.sst.sel(lat=50.125)
row1 = ds180.sst.sel(lat=50.125)
print(f"original order: from {float(row0.lon[0])} to {float(row0.lon[-1])}; 15°W (345°E) at index {int(np.where(row0.lon.values >= 345)[0][0])}")
print(f"converted order: from {float(row1.lon[0])} to {float(row1.lon[-1])}; 0° at index {int(np.argmin(abs(row1.lon.values)))}")
original order: from 0.125 to 359.875; 15°W (345°E) at index 1380
converted order: from -179.875 to 179.875; 0° at index 719
In the original order a strip along 50°N runs east from Greenwich and reaches 15°W only at index 1380, near the end; after conversion it starts at the date line and Greenwich is in the middle, at index 719, so the Atlantic plots in one piece.
Two longitude conventions
Longitude has two common conventions. Land-based data and most web maps use -180 to 180, with west negative. Many global ocean and atmosphere products use 0 to 360 east, which keeps the Pacific, the largest ocean, in one piece in the middle of the array and avoids a seam at the date line, where much of their work is. Neither is wrong, but code written for one silently fails on the other, because a selection outside the coordinate range is an empty result, not an error.
The conversion (lon + 180) % 360 - 180 maps 0–360 to -180 to 180, but leaves the array in its old order, with the western hemisphere after the eastern; sortby("lon") puts it back in increasing order, which slicing and plotting need. On a server, the convention is fixed by the dataset, so the request has to match it. CoastWatch used to publish OISST in both layouts; its -180 to 180 copies were withdrawn in 2026, and the 0–360 one is what remains.
Point data, cell edges and rioxarray
- Point data: convert the grid, not the points; or convert points to 0–360 with
lon % 360if the grid must stay as it is. - Cell edges: a 0–360 grid with cell centres at 0.125 to 359.875 has no cell centred on 0°; after conversion the cell centres either side are -0.125 and 0.125.
- Writing files: converting coordinates in memory changes nothing on disk; write the result if other tools need the same layout.
- rioxarray: for rasters,
rio.write_crsandrio.reprojecthandle 0–360 grids, but a plain coordinate shift is cheaper and exact.
Internal links
- How to download NOAA OISST sea surface temperature in Python — the -180 to 180 layout on ERDDAP
- My points plot in the ocean: fixing swapped latitude and longitude — the coordinate-order mistake
- A coastline or EEZ breaks at the antimeridian — the other seam
FAQ
Why does selecting negative longitudes return nothing?
The grid stores longitude from 0 to 360, so negative values do not exist; convert with (lon + 180) % 360 - 180 and sort, or use the 0–360 equivalent.
How do I convert longitude from 0-360 to -180-180 in xarray?
ds.assign_coords(lon=(ds.lon + 180) % 360 - 180).sortby("lon").
What is 12 degrees west in 0-360 longitude?
348 degrees east: add 360 to any negative longitude.
Which OISST files use 0-360 longitude?
NCEI's daily files and CoastWatch's ERDDAP aggregation, ncdcOisst21Agg; the -180 to 180 versions CoastWatch used to offer were withdrawn in 2026.