
How to Map the Seasonal Cycle of Sea Surface Temperature in Python
On this page
Problem statement
Every patch of ocean has a seasonal cycle: a warmest month, a coldest month, and a range between them. Its size and timing vary enormously, from almost nothing at the equator to more than 10 °C off Korea and New England, and its timing flips between hemispheres. A map of the seasonal cycle is both a description of the ocean and the baseline every anomaly is measured against, and computing it well means choosing a climatological period, finding each cell's extremes, and handling the hemispheres and the lag between sunshine and the warmest water.
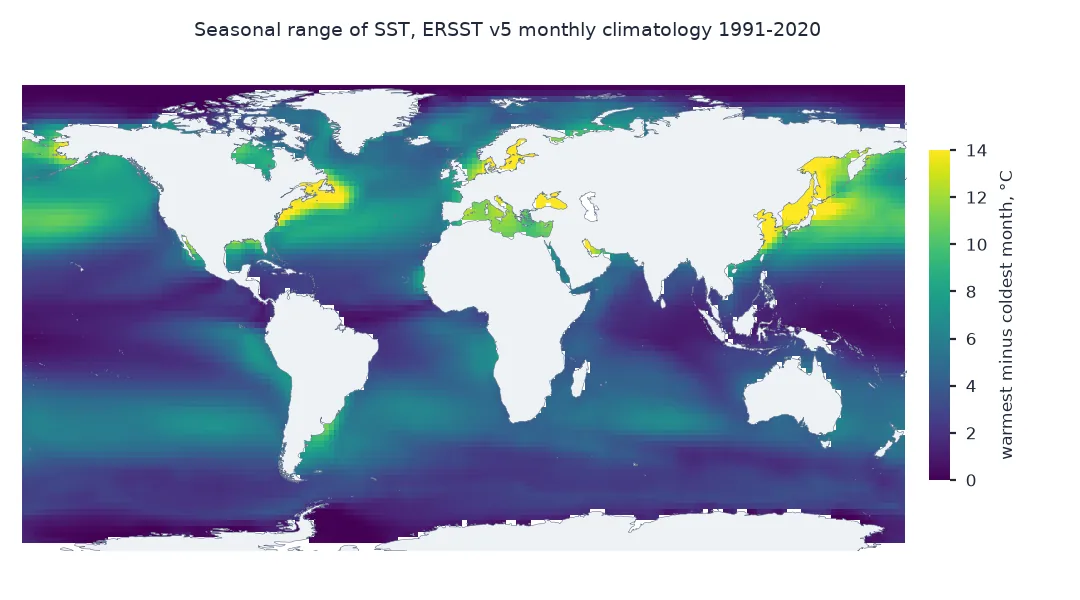
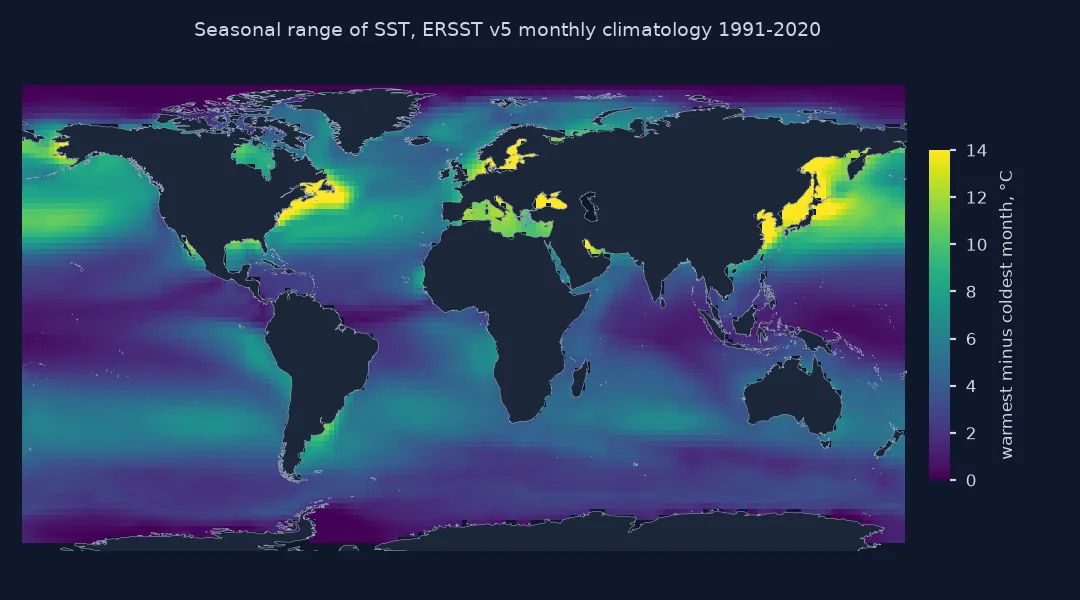
This page computes the 1991–2020 monthly climatology of ERSST v5 for every 2° cell, maps the seasonal range and the month of maximum temperature, finds where the range is largest, and measures how far the warmest month lags behind the summer solstice.
Quick answer
Group the base period by calendar month, average, and take each cell's range and the month of its maximum:
clim = SST.sel(time=slice("1991", "2020")).groupby("time.month").mean()
rng = clim.max("month") - clim.min("month")
warmest = clim.idxmax("month")
w = np.cos(np.deg2rad(rng.latitude))
print(f"seasonal range: area-weighted mean {float(rng.weighted(w).mean()):.2f} °C; largest {float(rng.max()):.1f} °C")
print(f"warmest month, northern mid-latitudes 30-60N: {int(warmest.sel(latitude=slice(30, 60)).to_series().mode()[0])}; southern 30-60S: {int(warmest.sel(latitude=slice(-60, -30)).to_series().mode()[0])}")
seasonal range: area-weighted mean 4.33 °C; largest 23.7 °C
warmest month, northern mid-latitudes 30-60N: 8; southern 30-60S: 2
Averaged by area over the world ocean, the difference between the warmest and coldest month of the 1991–2020 climatology is 4.33 °C, and in the most seasonal cell it is 23.7 °C. The most common warmest month is August between 30° and 60°N and February between 30° and 60°S: six months apart, and two months after each hemisphere's solstice.
Monthly climatology, largest ranges, the lag behind the sun
1. The monthly climatology
Thirty years of each calendar month make a stable mean:
months = SST.sel(time=slice("1991", "2020")).time.dt.month.to_series().value_counts()
print(f"values per calendar month: {months.min()} to {months.max()}; climatology shape {dict(clim.sizes)}")
print(f"warmest cell in the warmest month: {float(clim.max()):.2f} °C; coldest month-cell: {float(clim.min()):.2f} °C")
values per calendar month: 30 to 30; climatology shape {'month': 12, 'latitude': 89, 'longitude': 180}
warmest cell in the warmest month: 33.30 °C; coldest month-cell: -1.80 °C
Every calendar month has exactly 30 values in the base period, so each cell's climatology is a 30-year mean. Across all months and cells it runs from 33.30 °C to -1.80 °C, the freezing point of sea water that ERSST assigns under sea ice.
2. Where the range is largest
List the cells with the largest seasonal range and the range by latitude band:
t = rng.to_series().dropna()
print("largest ranges:", "; ".join(f"{la:.0f}°, {lo:.0f}°: {v:.1f} °C" for (la, lo), v in t.nlargest(4).items()))
for a, b in ((-80, -50), (-50, -20), (-20, 20), (20, 50), (50, 80)):
    band = rng.sel(latitude=slice(a, b))
    print(f"{a:>4} to {b:>3}: mean range {float(band.weighted(np.cos(np.deg2rad(band.latitude))).mean()):.2f} °C")
largest ranges: 40°, 120°: 23.7 °C; 40°, -76°: 23.1 °C; 40°, 122°: 22.9 °C; 38°, 120°: 22.9 °C
-80 to -50: mean range 2.34 °C
-50 to -20: mean range 4.67 °C
-20 to 20: mean range 2.73 °C
20 to 50: mean range 7.76 °C
50 to 80: mean range 6.50 °C
The four most seasonal cells are on the western sides of the northern oceans. Three are in the Bohai Sea and the northern Yellow Sea, shallow water off China and Korea whose monthly normals run from about 1–2 °C in winter to about 25 °C in August, ranges of 22.9–23.7 °C. The fourth, at 40°N, 76°W, is a 2° cell taking in the heads of Delaware and Chesapeake Bays, at 23.1 °C. By latitude, the northern mid-latitudes, 20–50°N, have the largest mean range, 7.76 °C, nearly three times the tropics' 2.73 °C; the Southern Ocean, with little land to chill it, has the smallest, 2.34 °C.
3. The lag behind the sun
The ocean stores heat, so its warmest month comes after the solstice. Measure the lag in mid-latitudes of each hemisphere:
nh = warmest.sel(latitude=slice(30, 60)).to_series().dropna()
sh = warmest.sel(latitude=slice(-60, -30)).to_series().dropna()
print(f"30-60 N: warmest month August in {(nh == 8).mean():.0%} of cells, September {(nh == 9).mean():.0%}, July {(nh == 7).mean():.0%}")
print(f"30-60 S: warmest month February in {(sh == 2).mean():.0%} of cells, March {(sh == 3).mean():.0%}, January {(sh == 1).mean():.0%}")
30-60 N: warmest month August in 84% of cells, September 16%, July 0%
30-60 S: warmest month February in 84% of cells, March 16%, January 0%
In both hemispheres' mid-latitudes, 84% of cells are warmest two months after the solstice and the other 16% three months after; not one is warmest in the month straight after it. The lag is the ocean's heat capacity: water keeps warming while it gains more heat than it loses, well past the sun's peak.
An anomaly is a departure from this cycle
The data used on this page
Monthly NOAA ERSST v5 on its 2° grid, January 1950 to August 2026, from NOAA CoastWatch's ERDDAP; the climatology uses 1991–2020, and the Caspian Sea, which the grid includes, is masked.
from pathlib import Path

import numpy as np
import pandas as pd
import requests
import xarray as xr

Path("data").mkdir(exist_ok=True)
p = Path("data/ersst_global_1950_202608.nc")
if not p.exists():
    q = "sst[(1950-01-01):1:(2026-08-01)][(0.0)][(-88):1:(88)][(-180):1:(178)]"
    p.write_bytes(requests.get(f"https://coastwatch.pfeg.noaa.gov/erddap/griddap/nceiErsstv5_LonPM180.nc?{q}", timeout=900).content)
SST = xr.open_dataset(p).sst.squeeze(drop=True)
caspian = (SST.latitude > 35) & (SST.latitude < 48) & (SST.longitude > 45) & (SST.longitude < 56)
SST = SST.where(~caspian)                                                          # the grid includes the Caspian Sea, a lake
print(f"{SST.sizes['time']} months, {SST.sizes['latitude']} x {SST.sizes['longitude']} cells; Caspian masked")
920 months, 89 x 180 cells; Caspian masked
Example 1: an anomaly is a departure from this cycle
Pick one month and show how the climatology turns a temperature into an anomaly at three places:
aug25 = SST.sel(time="2025-08").squeeze("time")
for name, (la, lo) in {"off New England": (40, -68), "equatorial Pacific": (0, -140), "North Sea": (56, 4)}.items():
    t = float(aug25.sel(latitude=la, longitude=lo, method="nearest"))
    c = float(clim.sel(month=8, latitude=la, longitude=lo, method="nearest"))
    r = float(rng.sel(latitude=la, longitude=lo, method="nearest"))
    print(f"{name:>19}: August 2025 {t:.2f} °C, August normal {c:.2f} °C, anomaly {t - c:+.2f} °C, seasonal range {r:.1f} °C")
off New England: August 2025 22.82 °C, August normal 22.70 °C, anomaly +0.12 °C, seasonal range 13.2 °C
equatorial Pacific: August 2025 25.41 °C, August normal 25.92 °C, anomaly -0.52 °C, seasonal range 1.6 °C
North Sea: August 2025 17.23 °C, August normal 16.62 °C, anomaly +0.61 °C, seasonal range 10.8 °C
The same August can be warm in absolute terms and near normal, or cool and unusual. Off New England, August 2025 at 22.82 °C was only 0.12 °C above its normal, in a cell whose seasonal range is 13.2 °C. The equatorial Pacific was 0.52 °C below its August normal, in a cell with a seasonal range of only 1.6 °C, so that departure is a third of its whole annual swing. The North Sea was 0.61 °C above normal.
The ocean's response to the seasons
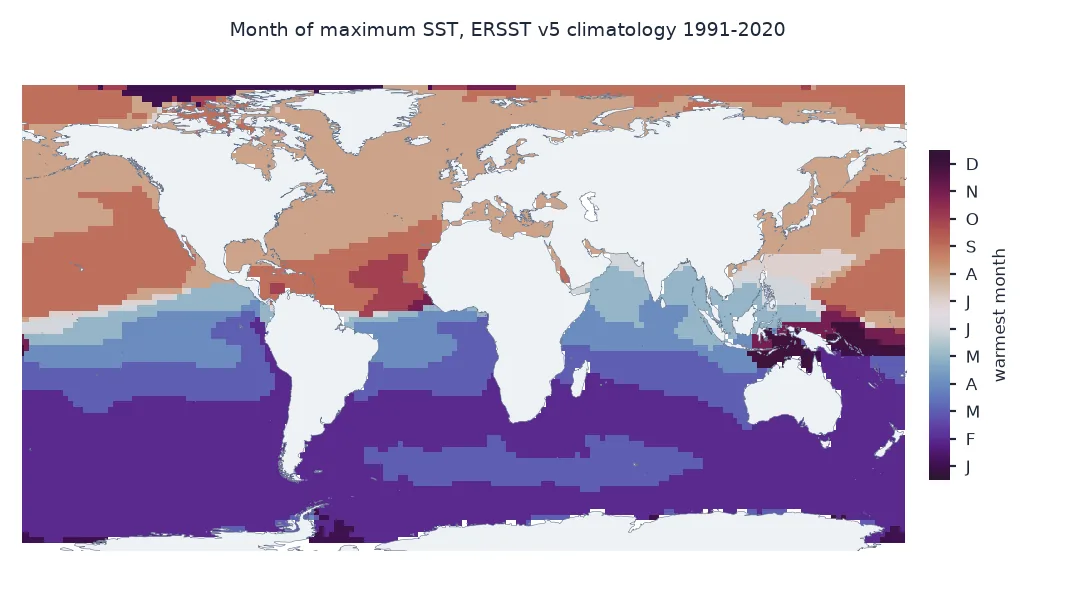
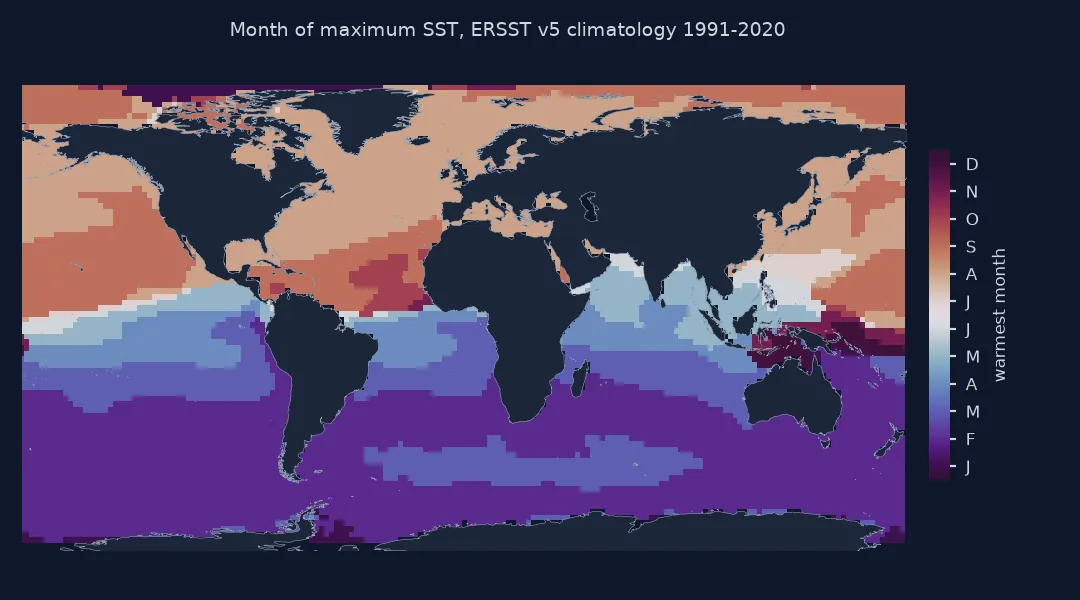
The seasonal cycle of sea surface temperature is the ocean's response to the seasonal cycle of sunshine, filtered through its heat capacity and its currents. Water warms slowly and holds heat, so the range is smaller than over land and the warmest month comes weeks after the solstice: in August or September in the northern mid-latitudes, February or March in the southern. Near the equator sunshine varies little through the year and so does temperature. The largest ranges occur on the western sides of the mid-latitude oceans, off East Asia and North America, where cold continental air blows over the sea in winter and shallow shelves and western boundary currents shape summer temperatures.
The climatology is also the denominator of every anomaly. A one-degree anomaly means little where the seasonal range is 12 °C and a lot where it is 1 °C, which is why some analyses standardise anomalies by local variability, and why marine heatwave definitions use local percentiles. Monthly climatologies like this one are smooth enough for most uses; daily climatologies need smoothing across neighbouring days, as in the marine heatwave guide.
Sea ice, flat cycles and harmonics
- Sea ice: cells under seasonal ice show a small winter range at -1.8 °C and a summer rise; their "range" is partly an ice season, not a temperature cycle.
- Base period: the 1991–2020 climatology is warmer than earlier ones; the range changes less than the mean.
- Month of maximum on a flat cycle: near the equator the warmest month can flip between neighbouring cells because the cycle is nearly flat; treat the map there as noise.
- Harmonics: fitting an annual cosine gives amplitude and phase with less noise than maximum minus minimum.
Internal links
- How to map sea surface temperature anomalies in Python — departures from the cycle
- Fixing sea surface temperature anomalies that disagree between sources — different climatologies
- How to map sea surface temperature trends in Python — the long-term change on top of the cycle
FAQ
How do I compute an SST climatology in Python?
Select the base period, for example 1991–2020, and use groupby("time.month").mean() in xarray to get one mean field per calendar month.
Where is the seasonal cycle of sea surface temperature largest?
On the western sides of the northern mid-latitude oceans, off East Asia and North America; step 2 lists the largest ranges in ERSST.
When is the ocean warmest?
In August or September in the northern mid-latitudes and February or March in the southern, weeks after the summer solstice.
Why does the warmest month lag the solstice?
The ocean's heat capacity means it keeps warming as long as it gains more heat than it loses, which continues after the sun's peak.