
How to Detect Marine Heatwaves in Python
On this page
Problem statement
A marine heatwave is a period of unusually warm sea water, but "unusual" needs a definition before it can be counted, mapped or compared. The one most studies use, from Hobday and colleagues (2016), defines it against the local seasonal cycle: at least five consecutive days above the 90th percentile of temperatures for that time of year, with a 30-year baseline. Implementing it takes a daily climatology with a moving window, a smoothed threshold, run detection that joins short breaks, and the intensity categories that classify each event.
This page builds that from scratch with pandas on 42 years of daily OISST for a box off the west coast of Ireland, finds the 2023 events, classifies them, and counts marine heatwave days per year since 1982.
Quick answer
Compute a day-of-year 90th percentile from the baseline, mark days above it, and keep runs of five days or more:
clim, thresh = climatology(T, "1991-01-01", "2020-12-31")
hot = T > thresh
ev = events(hot, min_days=5, max_gap=2)
y23 = ev[ev.start.dt.year == 2023]
print(f"{len(ev)} events 1982-2023; in 2023: {len(y23)}")
print(y23.assign(peak=[float((T - clim)[s:e].max()) for s, e in zip(y23.start, y23.end)]).to_string(
    index=False, formatters={"start": "{:%d %b}".format, "end": "{:%d %b}".format, "peak": "{:+.2f} °C".format}))
88 events 1982-2023; in 2023: 6
start end days peak
25 Feb 03 Mar 7 +0.69 °C
15 Mar 02 Apr 19 +0.81 °C
01 May 13 May 13 +1.25 °C
24 May 06 Jul 44 +3.74 °C
01 Sep 22 Sep 22 +2.14 °C
23 Oct 09 Nov 18 +1.58 °C
The method finds 88 marine heatwaves in 42 years, six of them in 2023. The one that started on 24 May lasted 44 days to 6 July and peaked 3.74 °C above the seasonal normal, during the record north-east Atlantic heatwave of June 2023.
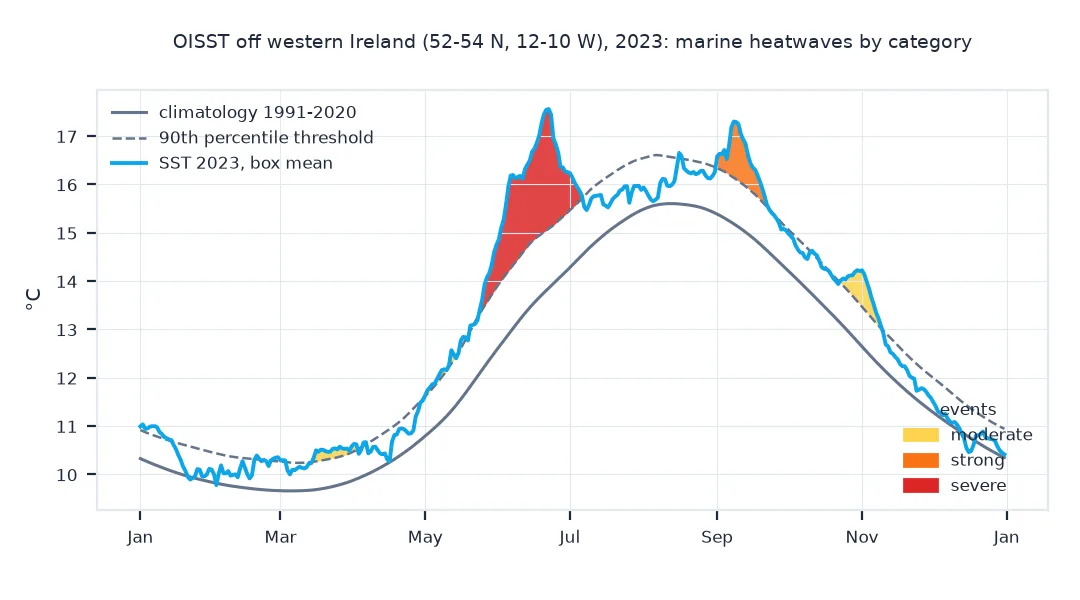
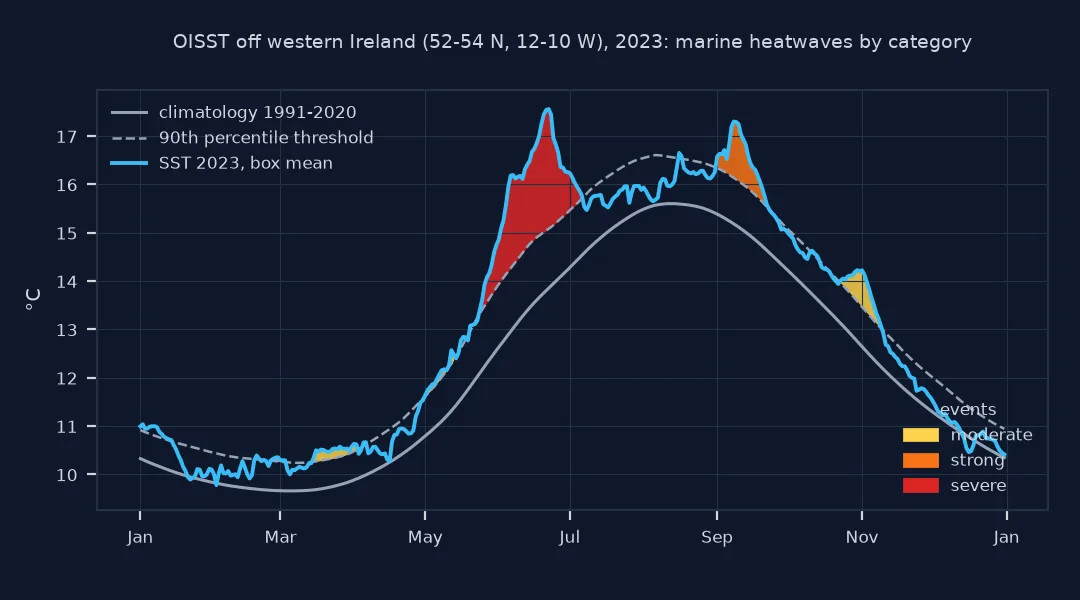
Climatology and threshold, hot days into events, categories
1. The climatology and the threshold
For each day of the year, pool the baseline temperatures within five days either side, take the mean and the 90th percentile, and smooth both with a 31-day moving average:
doy = T.index.dayofyear.where(~(T.index.is_leap_year & (T.index.dayofyear > 59)), T.index.dayofyear - 1)  # 365-day calendar
doy = pd.Series(np.where((T.index.month == 2) & (T.index.day == 29), 59, doy), index=T.index)
print(f"days in the series: {len(T):,}; baseline days: {int(T['1991':'2020'].count()):,}")
print(f"climatology: coldest {clim.min():.2f} °C, warmest {clim.max():.2f} °C; threshold above climatology by {(thresh - clim).min():.2f} to {(thresh - clim).max():.2f} °C")
print(f"days above the threshold, all years: {int(hot.sum()):,} ({hot.mean():.1%}); in the baseline: {hot['1991':'2020'].mean():.1%}")
days in the series: 15,340; baseline days: 10,958
climatology: coldest 9.66 °C, warmest 15.60 °C; threshold above climatology by 0.58 to 1.32 °C
days above the threshold, all years: 1,474 (9.6%); in the baseline: 9.3%
The climatology runs from 9.66 °C in late winter to 15.60 °C in late summer, and the threshold sits 0.58 to 1.32 °C above it, furthest in summer, when temperatures vary most from year to year. In the baseline 9.3% of days exceed it, close to the 10% a 90th percentile implies; the smoothing and the pooled window account for the difference.
2. From hot days to events
Runs shorter than five days are not events; two events separated by a gap of two days or less are one:
runs = (hot != hot.shift()).cumsum()[hot]
lengths = runs.value_counts()
print(f"runs of hot days: {len(lengths):,}; of 5 days or more: {(lengths >= 5).sum()}; after joining gaps of up to 2 days: {len(ev)}")
print(f"longest event: {ev.days.max()} days, from {ev.loc[ev.days.idxmax(), 'start']:%d %B %Y}")
runs of hot days: 244; of 5 days or more: 99; after joining gaps of up to 2 days: 88
longest event: 51 days, from 31 July 1995
Of 244 runs of hot days, 99 last five days or more, and joining runs separated by up to two days leaves 88 events. The longest is not from 2023 but from the summer of 1995: 51 days from 31 July.
3. Categories
Each event is classified by its peak intensity, in multiples of the local difference between the threshold and the climatology: moderate below 2, strong from 2, severe from 3, extreme from 4:
def category(s, e):
    ratio = ((T - clim) / (thresh - clim))[s:e].max()
    return ["moderate", "strong", "severe", "extreme"][min(int(ratio) - 1, 3)] if ratio >= 1 else "moderate"
ev["category"] = [category(s, e) for s, e in zip(ev.start, ev.end)]
print(ev.category.value_counts().reindex(["moderate", "strong", "severe", "extreme"], fill_value=0).to_string())
print(ev[ev.start.dt.year == 2023][["start", "days", "category"]].to_string(index=False, formatters={"start": "{:%d %b %Y}".format}))
category
moderate 68
strong 16
severe 4
extreme 0
start days category
25 Feb 2023 7 moderate
15 Mar 2023 19 moderate
01 May 2023 13 moderate
24 May 2023 44 severe
01 Sep 2023 22 strong
23 Oct 2023 18 moderate
68 of the 88 events are moderate, 16 strong and 4 severe; none reaches extreme. The June 2023 event is one of the four severe ones, peaking at more than three times the local gap between the threshold and the mean.
Marine heatwave days per year
The data used on this page
Daily NOAA OISST from 1 January 1982 to 31 December 2023 for 52°N to 54°N and 12°W to 10°W, averaged over the box with cosine-of-latitude weights. ERDDAP aggregations can miss days, and a day they lack comes back as its neighbour, so the setup takes each year from NOAA CoastWatch's ERDDAP — the version 2 aggregation to 2015 (NCEI states that v2 and v2.1 are the same before 2016), v2.1 after — fills every day it lacks from NCEI's daily files, and prints any year still short; the missing days fix shows why. The definition follows Hobday et al. (2016), Progress in Oceanography 141, with the 1991–2020 baseline.
import io
import time
from pathlib import Path

import numpy as np
import pandas as pd
import requests
import xarray as xr

Path("data").mkdir(exist_ok=True)
CW = "https://coastwatch.pfeg.noaa.gov/erddap/griddap"
ARCHIVE = "https://www.ncei.noaa.gov/data/sea-surface-temperature-optimum-interpolation/v2.1/access/avhrr"
def _get(url):
    for attempt in range(5):                                            # a busy ERDDAP answers 500 or 503
        r = requests.get(url, timeout=900)
        if r.status_code < 500:
            break
        time.sleep(30 * (attempt + 1))
    r.raise_for_status()
    return r
def _lon180(da):
    return da.assign_coords(longitude=(da.longitude + 180) % 360 - 180).sortby("longitude")
def oisst(start, end, path, var="sst", lat=(52, 54), lon=(-12, -10), step=1):
    """Daily OISST v2.1 for a box and dates, saved to path, longitudes -180 to 180. CoastWatch's ERDDAP
    aggregation (version 2 before 2016, the same analysis as v2.1 for those years), with every day it
    lacks taken from NCEI's daily archive: the aggregations skip days, and a skipped day is silent."""
    path = Path(path)
    if not path.exists():
        days = pd.date_range(start, end)
        ds = "ncdcOisst2Agg" if days[-1].year <= 2015 else "ncdcOisst21Agg"
        a, b = lon[0] % 360, lon[1] % 360
        got = []
        for lo in [(a, b)] if a <= b else [(a, 359.875), (0.125, b)]:          # across 0°, two requests
            q = (f"{var}[({start}T12:00:00Z):1:({end}T12:00:00Z)][(0.0)]"
                 f"[({lat[0]}):{step}:({lat[1]})][({lo[0]}):{step}:({lo[1]})]")
            got.append(xr.open_dataset(io.BytesIO(_get(f"{CW}/{ds}.nc?{q}").content))[var].load())
        da = _lon180(xr.concat(got, "longitude").squeeze("zlev", drop=True))
        da = da.sel(time=slice(start, f"{end}T23:59"))                       # a missing end day snaps past it
        for day in days.difference(pd.DatetimeIndex(da.time.values).normalize()):
            url = f"{ARCHIVE}/{day:%Y%m}/oisst-avhrr-v02r01.{day:%Y%m%d}.nc"
            d = xr.open_dataset(io.BytesIO(_get(url).content))[var].squeeze("zlev", drop=True)
            d = _lon180(d.rename(lat="latitude", lon="longitude"))
            d = d.sel(latitude=da.latitude, longitude=da.longitude, method="nearest")
            da = xr.concat([da, d.assign_coords(latitude=da.latitude, longitude=da.longitude).load()], "time")
        da.sortby("time").to_dataset(name=var).to_netcdf(path)
    return xr.open_dataset(path)[var]
def oisst_year(year, var="sst", lat=(52, 54), lon=(-12, -10), tag="ireland_west"):
    return oisst(f"{year}-01-01", f"{year}-12-31", f"data/oisst_{tag}_{var}_{year}.nc", var, lat, lon)
da = xr.concat([oisst_year(y) for y in range(1982, 2024)], "time")
T = da.weighted(np.cos(np.deg2rad(da.latitude))).mean(["latitude", "longitude"]).to_series()
T.index = T.index.normalize()
def climatology(t, start, end, window=5, smooth=31):
    """Day-of-year mean and 90th percentile over a baseline, with a +-window pool and a smoothing window, on a 365-day calendar."""
    d = t.index.dayofyear - ((t.index.is_leap_year) & (t.index.dayofyear > 59)).astype(int)
    d = np.where((t.index.month == 2) & (t.index.day == 29), 59, d)
    base = pd.Series(t.values, index=d)[(t.index >= start) & (t.index <= end)]
    m, p = {}, {}
    for k in range(1, 366):
        near = [(k + o - 1) % 365 + 1 for o in range(-window, window + 1)]
        v = base[base.index.isin(near)]
        m[k], p[k] = v.mean(), v.quantile(0.9)
    sm = lambda s: pd.concat([s.iloc[-smooth:], s, s.iloc[:smooth]]).rolling(smooth, center=True).mean().iloc[smooth:-smooth]
    m, p = sm(pd.Series(m)), sm(pd.Series(p))
    return pd.Series(m.loc[d].values, index=t.index), pd.Series(p.loc[d].values, index=t.index)
def events(hot, min_days=5, max_gap=2):
    """Start, end and length of runs of hot days lasting min_days or more, joined across gaps of max_gap days or fewer."""
    r = (hot != hot.shift()).cumsum()
    runs = [(g.index[0], g.index[-1]) for _, g in hot[hot].groupby(r[hot]) if len(g) >= min_days]
    joined = []
    for s, e in runs:
        if joined and (s - joined[-1][1]).days - 1 <= max_gap:
            joined[-1] = (joined[-1][0], e)
        else:
            joined.append((s, e))
    return pd.DataFrame({"start": [s for s, _ in joined], "end": [e for _, e in joined], "days": [(e - s).days + 1 for s, e in joined]})
per_year = T.groupby(T.index.year).size()
expected = pd.Series([366 if pd.Timestamp(y, 1, 1).is_leap_year else 365 for y in per_year.index], index=per_year.index)
short = (expected - per_year)[per_year < expected]
print(f"{da.sizes['latitude']} x {da.sizes['longitude']} cells, {len(T):,} days from {T.index[0]:%Y-%m-%d} to {T.index[-1]:%Y-%m-%d}")
print(f"years with missing days: {({int(k): int(v) for k, v in short.items()}) if len(short) else 'none'}")
9 x 9 cells, 15,340 days from 1982-01-01 to 2023-12-31
years with missing days: none
The box is 9 by 9 cells, and the series has all 15,340 days from 1982 to 2023: the two days of 2011 that CoastWatch's version 2 aggregation lacks came from NCEI's daily files.
Example 1: marine heatwave days per year
Count the days inside events in each year and compare the decades:
inside = pd.Series(False, index=T.index)
for s, e in zip(ev.start, ev.end):
    inside[s:e] = True
per_year = inside.groupby(inside.index.year).sum()
dec = per_year.groupby((per_year.index // 10) * 10).mean().round(0).astype(int)
dec.index = [f"{d}s" for d in dec.index]
print(dec.rename("mean MHW days per year").to_string())
print(f"most: {per_year.idxmax()} with {per_year.max()} days; years with none: {(per_year == 0).sum()}")
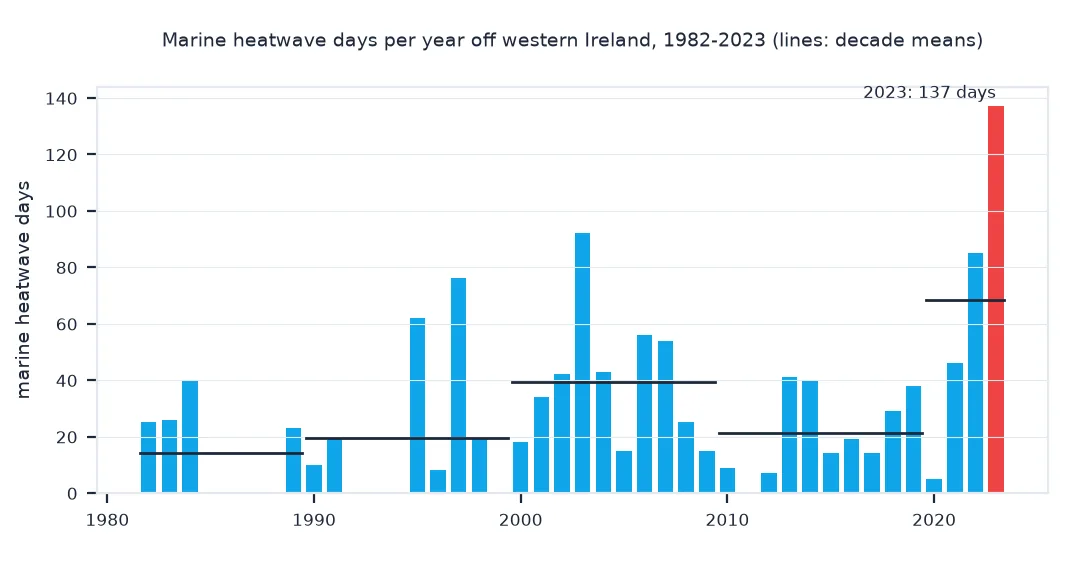
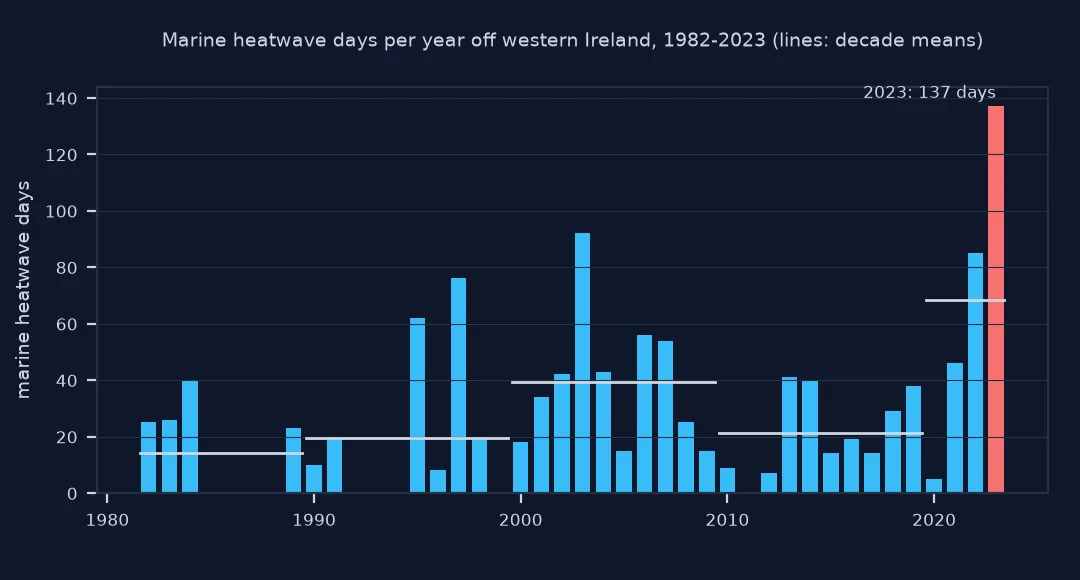
1980s 14
1990s 19
2000s 39
2010s 21
2020s 68
most: 2023 with 137 days; years with none: 9
Marine heatwave days have risen from 14 a year in the 1980s to 68 a year in 2020–2023 against the same 1991–2020 baseline, and 2023 had the most, 137 days. Nine years had none. Part of the rise is the warming trend itself, as the explainer measures by detrending the series.
A definition relative to season and place
The definition is relative in two ways. It compares each day with the same time of year, so a warm winter can be a heatwave while being colder than an ordinary summer; and it uses the local 90th percentile, so the same rule works in the tropics and at high latitudes. The 11-day window pools enough days to estimate a percentile from 30 years; the 31-day smoothing removes the noise that would otherwise put kinks into the threshold. The five-day minimum separates heatwaves from a few warm days, and joining across two-day gaps keeps one long event from being counted as several.
The categories, introduced by Hobday and colleagues in 2018, scale intensity by the local variability: the distance between the 90th percentile and the mean. An event that peaks twice that distance above the climatology is strong, three times severe, four times extreme. A fixed baseline makes warming visible as more heatwave days; a moving baseline, as some studies use, measures departures from recent conditions instead. Which baseline was used changes the counts and should always be stated.
Leap days, boxes and baselines
- Leap days: a day-of-year index shifts every date after 28 February by one in leap years; map dates to a 365-day calendar, as here, so 1 March is always day 60.
- Box or cell: averaging a box first smooths the series and finds fewer, longer events than running the method on each cell; say which was done.
- Baseline period: Hobday et al. suggest 30 years; the original paper used 1983–2012, recent work 1991–2020.
- Packages:
marineHeatWaves(Python) andheatwaveR(R) implement the same definition with more options; a from-scratch version is a good check on them.
Internal links
- How to download NOAA OISST sea surface temperature in Python — the data
- How to count heatwave days in Python — the same idea on land
- Marine heatwaves explained — definition and categories
FAQ
How is a marine heatwave defined?
By Hobday et al. (2016): at least five consecutive days with sea surface temperature above the seasonally varying 90th percentile of a 30-year baseline, with gaps of two days or less joined.
How do I detect marine heatwaves in Python?
Compute a day-of-year climatology and 90th percentile with an 11-day window and 31-day smoothing, flag days above the threshold, find runs of five or more days, and join runs separated by two days or less.
What are marine heatwave categories?
Moderate, strong, severe and extreme, for peak intensities of one, two, three and four times the difference between the 90th percentile threshold and the climatological mean.
Was 2023 a marine heatwave year off Ireland?
Yes: the 2023 events for this box are listed in the quick answer and in step 3, including the June event during the record north-east Atlantic heatwave.