
Degree Heating Weeks Explained
On this page
Problem statement
Degree Heating Weeks (DHW) is the number reef managers watch every summer: 4 °C-weeks and bleaching is likely, 8 and severe bleaching with mortality is expected. It is also easy to misread. It is not a temperature, not an anomaly against the average, and not a count of hot days; it is heat accumulated above a reef's normal summer maximum over the previous twelve weeks, counting only days that are at least a degree too warm. Rebuilding it from its parts makes clear what it does and does not measure.
This page takes one pixel on the Great Barrier Reef through the 2024 summer, recovers its summer maximum from Coral Reef Watch's own products, reconstructs DHW from daily HotSpots, checks the result against Coral Reef Watch's published DHW, and shows why a reef can be at its hottest and still accumulating stress weeks later.
Quick answer
Keep the daily HotSpots of at least 1 °C, sum them over the last 84 days, and divide by seven:
hs = D.hotspot.where(D.hotspot >= 1, 0)
mine = hs.rolling(84, min_periods=84).sum() / 7
both = pd.DataFrame({"reconstructed": mine, "crw": D.dhw}).dropna()
print(f"pixel {LAT:.3f}, {LON:.3f}: {len(both)} days compared; largest difference {float((both.reconstructed - both.crw).abs().max()):.2f} °C-weeks")
print(f"peak DHW: reconstructed {both.reconstructed.max():.2f}, Coral Reef Watch {both.crw.max():.2f} on {both.crw.idxmax():%d %B %Y}")
pixel -23.775, 151.125: 161 days compared; largest difference 0.00 °C-weeks
peak DHW: reconstructed 20.30, Coral Reef Watch 20.30 on 06 March 2024
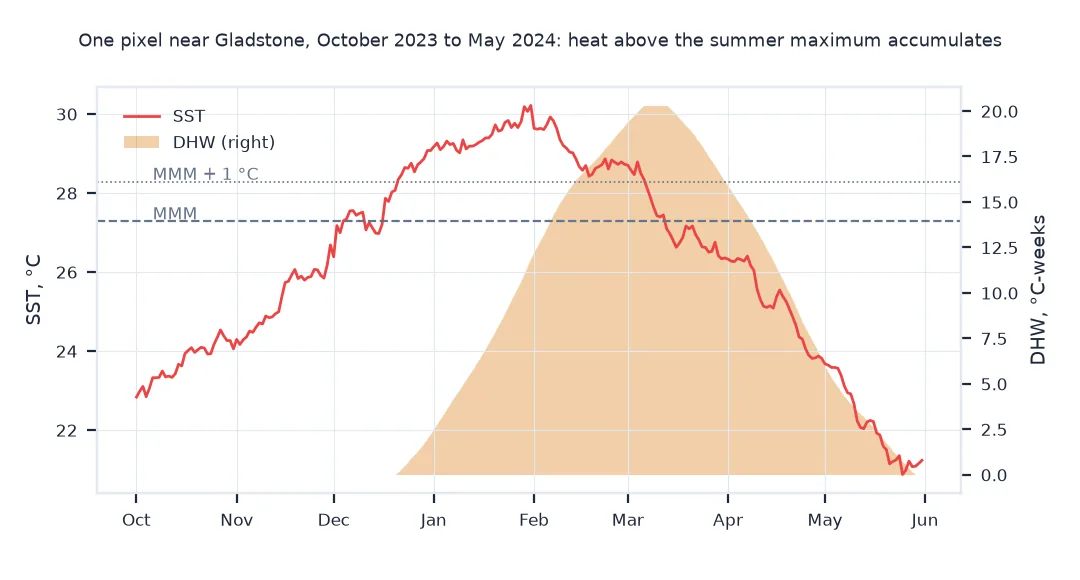
Over the 161 days on which a full 84-day window exists, the reconstruction matches Coral Reef Watch's published DHW to the second decimal on every day. Both peak at 20.30 °C-weeks on 6 March 2024, more than two and a half times the threshold for severe bleaching.
The summer maximum, the one-degree rule, accumulated stress
1. The summer maximum the HotSpot is measured from
A HotSpot is today's temperature above the pixel's maximum monthly mean (MMM), the mean of its warmest month in the climatology. On days with a positive HotSpot, temperature minus HotSpot gives the MMM back:
pos = D.hotspot > 0
mmm = (D.sst - D.hotspot)[pos]
print(f"MMM recovered on {int(pos.sum())} days: {mmm.median():.2f} °C (spread {mmm.max() - mmm.min():.3f} °C)")
print(f"warmest day {D.sst.max():.2f} °C on {D.sst.idxmax():%d %b}, {D.sst.max() - mmm.median():+.2f} °C above the MMM")
print(f"HotSpot floor: smallest value in the product {float(D.hotspot.min()):.2f}")
MMM recovered on 94 days: 27.28 °C (spread 0.000 °C)
warmest day 30.21 °C on 31 Jan, +2.93 °C above the MMM
HotSpot floor: smallest value in the product -6.41
Temperature minus HotSpot gives the same MMM on all 94 days with a positive HotSpot, 27.28 °C, to three decimals: the HotSpot really is the temperature above one fixed number. The warmest day, 31 January, was 30.21 °C, 2.93 °C above it. Negative HotSpots are stored too, down to -6.41 in winter, and DHW ignores them.
2. Why only HotSpots of 1 °C or more count
Days just above the summer maximum are normal summer variability; only larger departures stress corals. Compare DHW with and without the 1 °C rule:
all_hs = D.hotspot.clip(lower=0).rolling(84, min_periods=84).sum() / 7
print(f"days with a HotSpot above 0: {int((D.hotspot > 0).sum())}; of at least 1 °C: {int((D.hotspot >= 1).sum())}")
print(f"peak DHW counting every positive HotSpot: {all_hs.max():.2f}; with the 1 °C rule: {mine.max():.2f} °C-weeks")
days with a HotSpot above 0: 94; of at least 1 °C: 77
peak DHW counting every positive HotSpot: 20.92; with the 1 °C rule: 20.30 °C-weeks
Of the 94 days above the MMM, 77 were at least 1 °C above it. Counting every positive HotSpot would raise the peak only from 20.30 to 20.92 °C-weeks: at this pixel almost all the excess heat came on days that were well above the summer maximum, so the rule hardly matters here. It matters most where temperatures hover just above the MMM for weeks.
3. Heat now, stress later
Because DHW sums the last twelve weeks, it keeps rising after the water has started to cool and falls only as hot days leave the window:
print(f"hottest day: {D.sst.idxmax():%d %b %Y}; largest HotSpot: {D.hotspot.idxmax():%d %b %Y}; peak DHW: {both.crw.idxmax():%d %b %Y}")
print(f"DHW crossed 4 on {both.crw[both.crw >= 4].index[0]:%d %b} and 8 on {both.crw[both.crw >= 8].index[0]:%d %b}; "
      f"back below 4 on {both.crw[(both.crw < 4) & (both.crw.index > both.crw.idxmax())].index[0]:%d %b}" if (both.crw >= 8).any() else "")
hottest day: 31 Jan 2024; largest HotSpot: 31 Jan 2024; peak DHW: 06 Mar 2024
DHW crossed 4 on 07 Jan and 8 on 21 Jan; back below 4 on 09 May
The water was hottest on 31 January, but DHW kept rising for five more weeks to its peak on 6 March, and stayed above 4 °C-weeks until 9 May, more than three months after the hottest day. It passed 4 on 7 January and 8 on 21 January, before the hottest day: the first HotSpot of 1 °C or more came on 21 December.
The same heat spread out or concentrated
The data used on this page
NOAA Coral Reef Watch version 3.1 daily 5 km SST, HotSpot and Degree Heating Weeks for one pixel, from NOAA CoastWatch's ERDDAP (noaacrwsstDaily, noaacrwhotspotDaily, noaacrwdhwDaily), from 1 October 2023 to 31 May 2024. The pixel is the one with the highest DHW in the Great Barrier Reef box of the coral bleaching guide on 18 March 2024, found in the setup.
import time
from pathlib import Path

import numpy as np
import pandas as pd
import requests
import xarray as xr

Path("data").mkdir(exist_ok=True)
E = "https://coastwatch.noaa.gov/erddap/griddap"
peak = Path("data/crw_dhw_peak_20240318.nc")
if not peak.exists():
    q = "degree_heating_week[(2024-03-18T12:00:00Z)][(-9.975):1:(-24.975)][(142.025):1:(154.975)]"
    r = requests.get(f"{E}/noaacrwdhwDaily.nc?{q}", timeout=600)
    r.raise_for_status()
    peak.write_bytes(r.content)
field = xr.open_dataset(peak).degree_heating_week.squeeze("time", drop=True)
top = field.where(field == field.max(), drop=True)
LAT, LON = float(top.latitude[0]), float(top.longitude[0])
def point(dataset, var):
    parts = []
    for m in pd.date_range("2023-10-01", "2024-05-01", freq="MS"):                # month by month: long requests time out
        p = Path(f"data/crw_{var}_{LAT:.3f}_{LON:.3f}_{m:%Y%m}.nc")
        if not p.exists():
            end = m + pd.offsets.MonthEnd(0)
            q = f"{var}[({m:%Y-%m-%d}T12:00:00Z):1:({end:%Y-%m-%d}T12:00:00Z)][({LAT})][({LON})]"
            for attempt in range(4):                                       # the server's proxy sometimes times out
                r = requests.get(f"{E}/{dataset}.nc?{q}", timeout=600)
                if r.ok:
                    break
                time.sleep(30)
            r.raise_for_status()
            p.write_bytes(r.content)
        parts.append(xr.open_dataset(p)[var].squeeze().to_series())
    s = pd.concat(parts)
    s.index = s.index.normalize()
    return s
D = pd.DataFrame({"sst": point("noaacrwsstDaily", "analysed_sst"), "hotspot": point("noaacrwhotspotDaily", "hotspot"),
                  "dhw": point("noaacrwdhwDaily", "degree_heating_week")})
print(f"pixel with the highest DHW on 18 March 2024: {LAT:.3f}, {LON:.3f} ({float(field.max()):.1f} °C-weeks); {len(D)} days")
pixel with the highest DHW on 18 March 2024: -23.775, 151.125 (19.4 °C-weeks); 244 days
On 18 March 2024 the most heat-stressed pixel in the box, at 19.4 °C-weeks, was at 23.775°S, 151.125°E, inshore near Gladstone at the southern end of the reef. The setup reads 244 days of its three products, from October 2023 to May 2024.
Example 1: the same heat, spread out or concentrated
DHW depends on how much heat accumulates, not how it is distributed. Compare two hypothetical twelve-week records with the same total: a steady 2 °C HotSpot for 14 days, and a 1 °C HotSpot for 28 days:
steady = pd.Series([2.0] * 14 + [0.0] * 70)
long = pd.Series([1.0] * 28 + [0.0] * 56)
short_mild = pd.Series([0.9] * 60 + [0.0] * 24)
for label, s in (("2 °C for 2 weeks", steady), ("1 °C for 4 weeks", long), ("0.9 °C for 60 days", short_mild)):
    print(f"{label:>19}: DHW {s.where(s >= 1, 0).sum() / 7:.1f} °C-weeks")
2 °C for 2 weeks: DHW 4.0 °C-weeks
1 °C for 4 weeks: DHW 4.0 °C-weeks
0.9 °C for 60 days: DHW 0.0 °C-weeks
Two weeks at 2 °C and four weeks at 1 °C both give 4.0 °C-weeks. Sixty days at 0.9 °C give none at all, though they carry far more heat in total, because no single day reaches the 1 °C threshold.
Built to match observed bleaching
Coral Reef Watch built DHW to match what reef scientists observed: bleaching follows heat that exceeds the warmest conditions corals normally experience, and its severity grows with both the size and the duration of the excess. The MMM sets "normally": for each pixel, the climatological mean of its warmest month, from a satellite baseline, so a reef in the cooler south and one in the warmer north are each compared with their own summers. The HotSpot is the excess on a given day. Counting only HotSpots of at least 1 °C screens out ordinary summer warmth, and summing over 84 days captures heat that builds over weeks. The unit, °C-weeks, is literally degrees times weeks: 4 °C-weeks can be two weeks at 2 °C or four weeks at 1 °C.
This makes DHW different from a marine heatwave index. A marine heatwave is defined against the 90th percentile for each day of the year, so it occurs in any season; DHW only responds to heat above the summer maximum, so it is near zero outside the warm season by design. And because it looks back twelve weeks, its peak comes after the hottest water, so the worst stress can arrive weeks after the hottest day: five weeks, at the pixel on this page.
Average thresholds, a fixed maximum and reef pixels
- Thresholds are averages: 4 and 8 °C-weeks are guides from observations across many reefs; some corals bleach earlier, others later, and repeated stress changes susceptibility.
- MMM is fixed: the climatology is not updated each year, so as oceans warm, DHW accumulates more often; Coral Reef Watch keeps the reference fixed so that stress is measured against the same baseline every year.
- Pixel versus reef: a 5 km pixel averages water over and around a reef; shallow reef flats can be warmer than the pixel.
- Products differ: regional products and older versions of the global product use different baselines and resolutions; compare like with like.
Internal links
- How to map coral bleaching heat stress with degree heating weeks in Python — DHW across the Great Barrier Reef
- Marine heatwaves explained — the percentile-based definition
- Sea surface temperature explained — what satellite SST measures
FAQ
How are degree heating weeks calculated?
By summing the daily HotSpots of at least 1 °C over the previous 84 days and dividing by seven, where a HotSpot is the day's temperature above the pixel's maximum monthly mean.
What is the maximum monthly mean?
The climatological mean temperature of a pixel's warmest month, the baseline above which HotSpots and DHW are measured.
Why does DHW keep rising after the water cools?
It accumulates the last twelve weeks of heat, so it rises while days with HotSpots of 1 °C or more keep arriving and falls only as they drop out of the window.
Is DHW the same as a marine heatwave?
No: DHW measures heat above the summer maximum, accumulated over 12 weeks; a marine heatwave is any period above the seasonal 90th percentile, in any season.