
How to Download NOAA OISST Sea Surface Temperature in Python
On this page
Problem statement
NOAA's Optimum Interpolation Sea Surface Temperature, OISST version 2.1, is the standard daily global sea surface temperature record: one value per day on a 0.25° grid since September 1981, gap-free because satellite, ship, buoy and Argo observations are blended into a complete field. The full files are a gigabyte per year, but most questions need a region and a few weeks. NOAA's ERDDAP servers answer exactly that: a URL that names the dataset, variable, dates and box returns a small NetCDF file.
This page builds an ERDDAP request for OISST, downloads the north-east Atlantic on 21 June 2023, during the record marine heatwave around the British Isles, checks what the file contains, and pulls a month of daily data for the same box.
Quick answer
Name the dataset, variable, time, depth, latitude and longitude ranges in the URL, download it, and open it with xarray. The dataset stores longitude from 0 to 360, so a box across 0° takes two requests, and a day the server lacks comes back as its neighbour, so check the dates:
def oisst(var, t0, t1, lat, lon, path):
    if not Path(path).exists():
        a, b = lon[0] % 360, lon[1] % 360
        parts = []
        for lo in [(a, b)] if a < b else [(a, 359.875), (0.125, b)]:              # across 0°: two requests
            q = f"{var}[({t0}T12:00:00Z):1:({t1}T12:00:00Z)][(0.0)][({lat[0]}):1:({lat[1]})][({lo[0]}):1:({lo[1]})]"
            r = requests.get(f"{ERDDAP}/ncdcOisst21Agg.nc?{q}", timeout=600)
            r.raise_for_status()
            parts.append(xr.open_dataset(io.BytesIO(r.content)).load())
        xr.concat(parts, "longitude").to_netcdf(path)
    da = xr.open_dataset(path)[var].squeeze("zlev", drop=True)
    da = da.assign_coords(longitude=(da.longitude + 180) % 360 - 180).sortby("longitude")
    got = pd.DatetimeIndex(da.time.values).normalize()
    assert got.equals(pd.date_range(t0, t1)), f"asked for {t0} to {t1}, got {got.min():%Y-%m-%d} to {got.max():%Y-%m-%d} ({len(got)} days)"
    return da
sst = oisst("sst", "2023-06-21", "2023-06-21", (45, 62), (-25, 10), "data/oisst_20230621.nc").squeeze("time")
print(f"{sst.sizes['latitude']} x {sst.sizes['longitude']} cells; {float(sst.min()):.1f} to {float(sst.max()):.1f} °C; "
      f"mean {float(sst.mean()):.2f} °C over {int(sst.notnull().sum()):,} ocean cells")
69 x 141 cells; 9.0 to 21.5 °C; mean 15.42 °C over 7,321 ocean cells
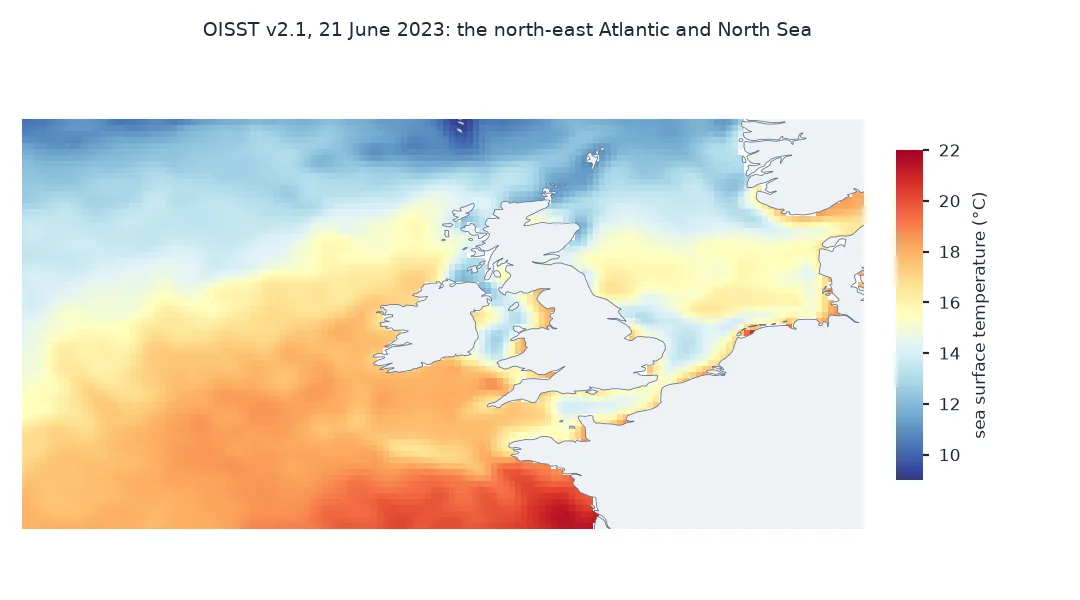
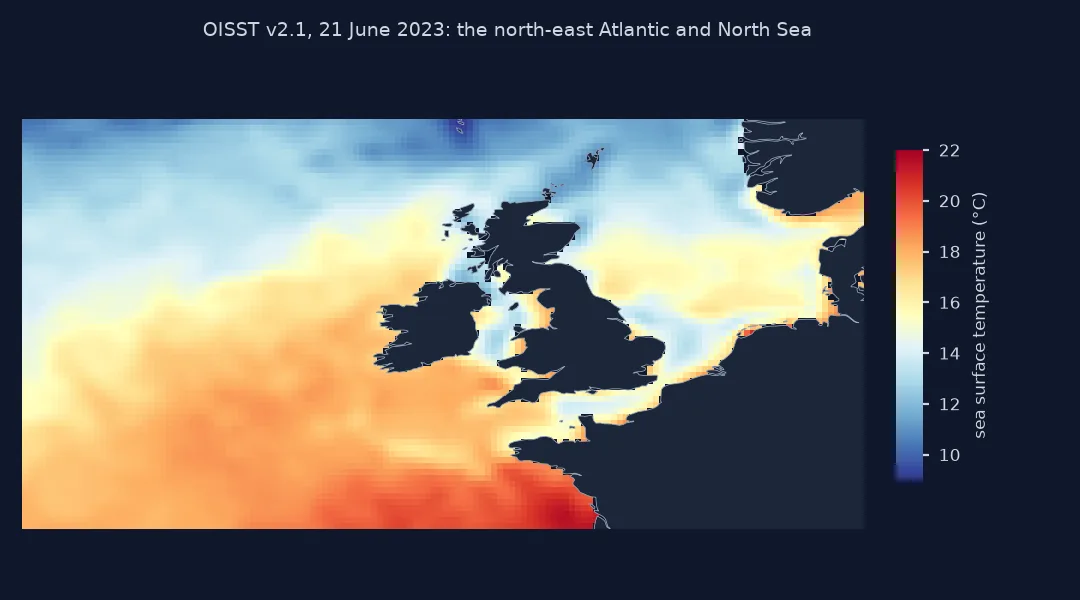
The box from 45°N to 62°N and 25°W to 10°E is 69 by 141 cells. On 21 June 2023 its water ranged from 9.0 °C in the north to 21.5 °C in the Bay of Biscay, averaging 15.42 °C over 7,321 ocean cells.
What the request asks for, what the file holds, the warmest water
1. What the request asks for
An ERDDAP griddap request lists, for each dimension in order, a start, a stride and a stop in parentheses. OISST has four dimensions: time, a single depth level zlev, latitude and longitude:
q = "sst[(2023-06-21T12:00:00Z):1:(2023-06-21T12:00:00Z)][(0.0)][(45):1:(62)][(335):1:(359.875)]"
r = requests.get(f"{ERDDAP}/ncdcOisst21Agg.nc?{q}", timeout=600)
print(r.status_code, r.headers.get("Content-Type"), f"{len(r.content) / 1e3:.0f} kB")
print(r.url.split("?")[1][:90])
200 application/x-netcdf 36 kB
sst%5B(2023-06-21T12:00:00Z):1:(2023-06-21T12:00:00Z)%5D%5B(0.0)%5D%5B(45):1:(62)%5D%5B(33
The server answers with a 36 kB NetCDF file for the western part of the box, 25°W to 0°; the eastern part, 0° to 10°E, is a second request, which the quick answer's function makes. requests percent-encodes the square brackets on the way out; typed into a browser, the same URL works unencoded.
2. What the file holds
The dataset carries four variables, each on the same grid. Look at the full record for the day, and how much of the box is land:
q = "sst,anom,err,ice".split(",")
ds = xr.Dataset({v: oisst(v, "2023-06-21", "2023-06-21", (45, 62), (-25, 10), f"data/oisst_20230621_{v}.nc") for v in q})
ds = ds.squeeze("time", drop=True)
for v in q:
    print(f"{v:>4}: {ds[v].attrs.get('long_name')} [{ds[v].attrs.get('units')}]; non-missing {int(ds[v].notnull().sum()):,}")
print(f"cells in the box: {ds.sst.size:,}; land (missing SST): {int(ds.sst.isnull().sum()):,}")
sst: Daily sea surface temperature [degree_C]; non-missing 7,321
anom: Daily sea surface temperature anomalies [degree_C]; non-missing 7,321
err: Estimated error standard deviation of analysed_sst [degree_C]; non-missing 7,321
ice: Sea ice concentration [1]; non-missing 0
cells in the box: 9,729; land (missing SST): 2,408
Every ocean cell has a temperature, an anomaly and an error estimate; in June the box has no sea ice, so ice is empty. 2,408 of the 9,729 cells are land.
3. Where the warmest and the most anomalous water was
anom is the departure from OISST's own daily climatology. Find the warmest cell and the largest anomaly:
def where(da):
    c = da.where(da == da.max(), drop=True)
    lon = float(c.longitude[0])
    return f"{float(c.latitude[0]):.3f} N, {abs(lon):.3f} {'E' if lon >= 0 else 'W'}"
print(f"warmest: {float(ds.sst.max()):.2f} °C at {where(ds.sst)}")
print(f"largest anomaly: {float(ds.anom.max()):+.2f} °C at {where(ds.anom)}")
print(f"box mean anomaly {float(ds.anom.mean()):+.2f} °C; cells more than 3 °C above normal: {int((ds.anom > 3).sum()):,} "
      f"({float((ds.anom > 3).sum() / ds.anom.notnull().sum()):.0%})")
warmest: 21.54 °C at 45.375 N, 2.375 W
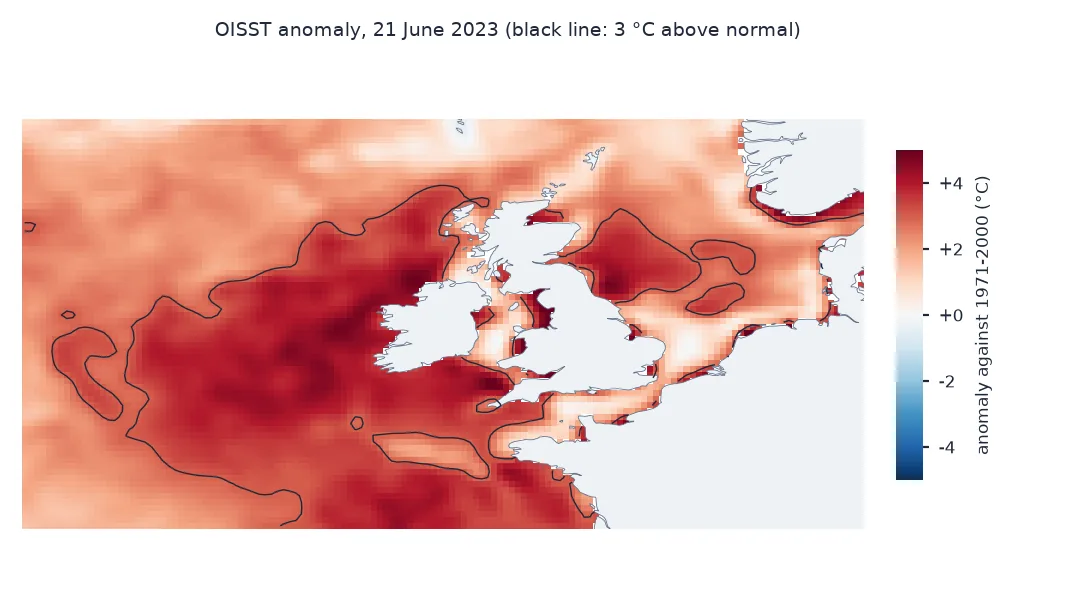
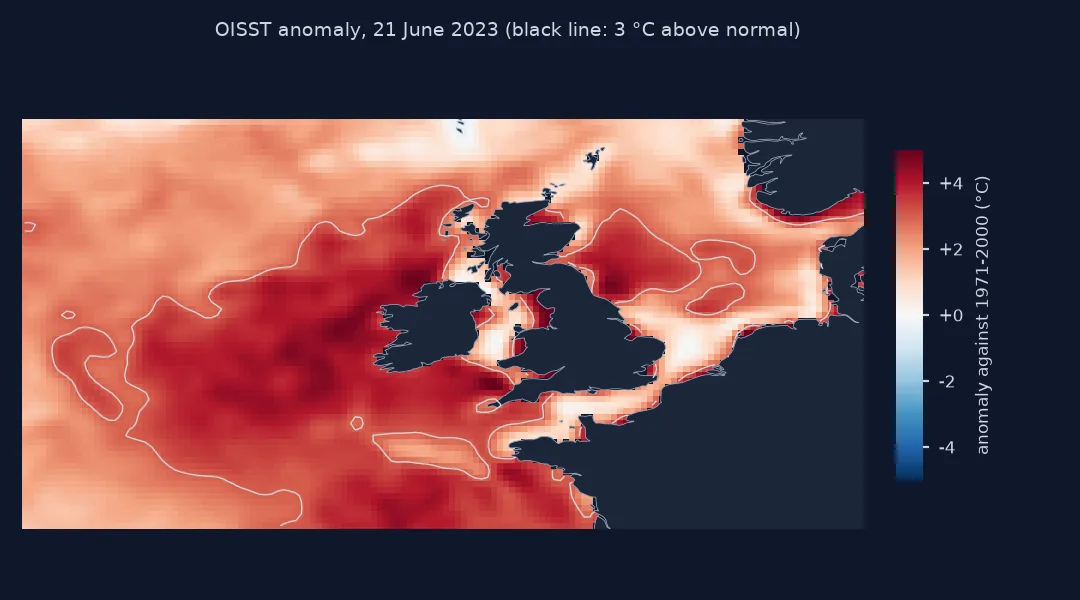
largest anomaly: +6.97 °C at 53.125 N, 5.375 E
box mean anomaly +2.66 °C; cells more than 3 °C above normal: 2,848 (39%)
The warmest water, 21.54 °C, was near the southern edge of the box, in the Bay of Biscay; the largest anomaly, +6.97 °C, was in the shallow Wadden Sea off the northern Netherlands. Averaged over the box the water was 2.66 °C above OISST's normal for the day, and in 39% of cells more than 3 °C above it.
A month of days for one box
The data used on this page
NOAA OISST v2.1 (AVHRR-only, final), served by NOAA CoastWatch West Coast's ERDDAP as dataset ncdcOisst21Agg, with longitudes from 0 to 360. Cite as Huang et al. (2021), Journal of Climate, and NOAA NCEI.
import io
from pathlib import Path

import numpy as np
import pandas as pd
import requests
import xarray as xr

Path("data").mkdir(exist_ok=True)
ERDDAP = "https://coastwatch.pfeg.noaa.gov/erddap/griddap"
info = requests.get(f"{ERDDAP}/ncdcOisst21Agg.das", timeout=120).text
start = info.split('time_coverage_start "')[1].split('"')[0]
names = [v for v in ("sst", "anom", "err", "ice") if "  " + v + " {" in info]
print(f"OISST v2.1 on ERDDAP from {start[:10]}; variables: {', '.join(names)}")
OISST v2.1 on ERDDAP from 1981-09-01; variables: sst, anom, err, ice
The dataset starts on 1 September 1981 and carries four variables.
Example 1: a month of days for one box
Ask for a range of dates in one request, and reduce it to a daily series of the box mean:
june = oisst("sst", "2023-06-01", "2023-06-30", (45, 62), (-25, 10), "data/oisst_202306.nc")
an = oisst("anom", "2023-06-01", "2023-06-30", (45, 62), (-25, 10), "data/oisst_202306_anom.nc")
w = np.cos(np.deg2rad(june.latitude))                                           # cells shrink towards the pole
s = june.weighted(w).mean(["latitude", "longitude"]).to_series()
d = an.weighted(w).mean(["latitude", "longitude"]).to_series()
print(f"{june.sizes['time']} days; file {Path('data/oisst_202306.nc').stat().st_size / 1e6:.1f} MB")
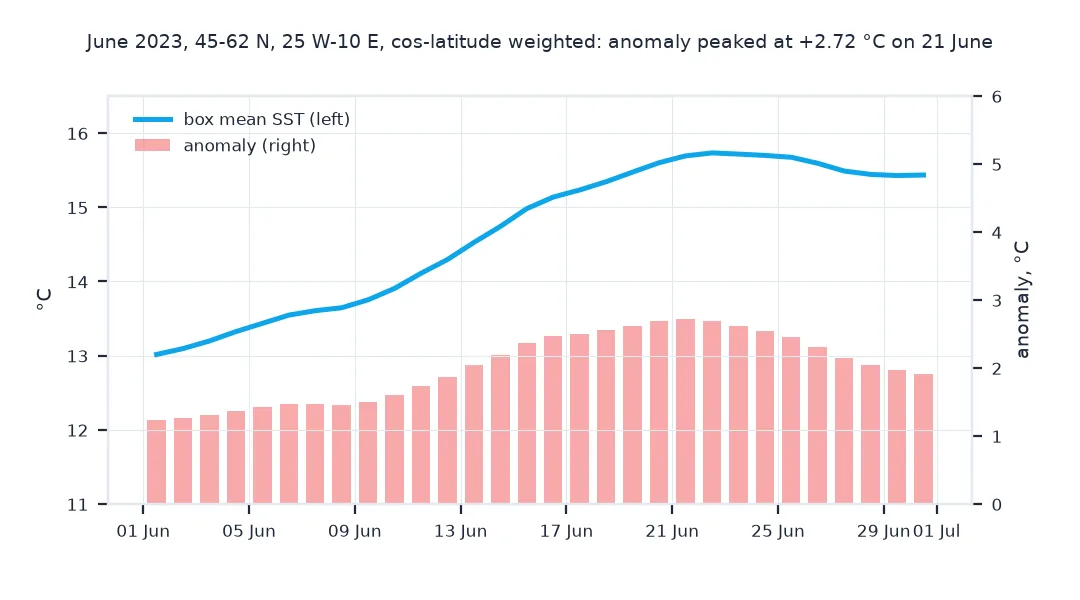
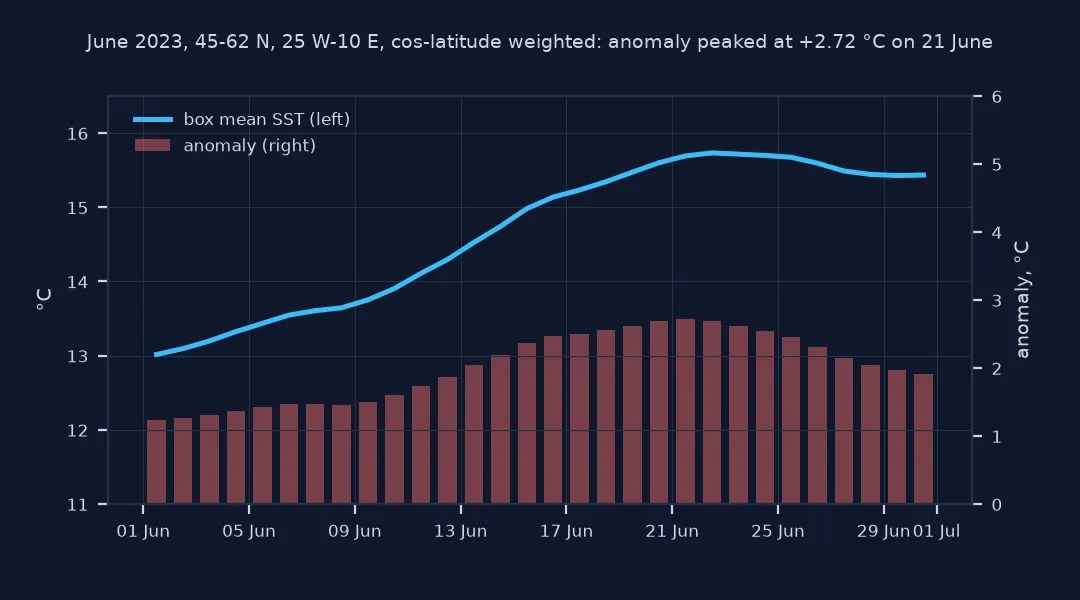
print(f"box mean SST {s.iloc[0]:.2f} °C on 1 June to {s.iloc[-1]:.2f} °C on 30 June; largest anomaly {d.max():+.2f} °C on {d.idxmax():%d %B}")
30 days; file 1.2 MB
box mean SST 13.02 °C on 1 June to 15.43 °C on 30 June; largest anomaly +2.72 °C on 21 June
June is 30 daily fields in a 1.2 MB file. Weighted by the cosine of latitude, the box warmed from 13.02 °C on 1 June to 15.43 °C on 30 June, and its anomaly peaked at +2.72 °C on 21 June; the unweighted mean in step 3, +2.66 °C, gives the smaller northern cells as much weight as the southern ones.
OISST is an analysis, not a measurement
OISST is an analysis, not a measurement: satellite and in situ observations interpolated onto the grid, with a value in every ocean cell every day and an error estimate, err, that says where the value rests on few observations; sea surface temperature explained compares it with the measurements behind it.
The AVHRR-only version used here has been produced consistently since 1981, which is what climate studies need. Each day appears first in a preliminary, near-real-time version and is replaced about two weeks later by the final one, so recent days in the NrtAgg datasets can change. CoastWatch's ERDDAP serves the data with longitudes from 0 to 360, as NCEI distributes it; the -180 to 180 copies it used to offer were withdrawn in 2026, which is why the function above splits a box that crosses 0° and converts the result back. The aggregation also lacks some days, and asked for one it returns the nearest day it has instead, so the function checks the dates it got; missing days on ERDDAP measures how many.
Time stamps, baselines and large requests
- Time stamps: each daily value is labelled at 12:00 UTC; ask for
T12:00:00Z, or ERDDAP snaps to the nearest day. - Anomaly baseline: OISST's
anomis relative to a 1971–2000 climatology; anomalies against the 1991–2020 normals are smaller, as the baseline fix shows. - Large requests: ERDDAP refuses responses over its size limit; split long time ranges into years or use a stride.
Internal links
- How to subset an ocean model NetCDF by depth and time — a different ocean product
- How to detect marine heatwaves in Python — what to do with a daily series
- Sea surface temperature explained — skin, bulk and analysis temperatures
FAQ
How do I download OISST data in Python?
Request a subset from an ERDDAP server, for example https://coastwatch.pfeg.noaa.gov/erddap/griddap/ncdcOisst21Agg.nc?sst[(date)][(0.0)][(lat0):1:(lat1)][(lon0):1:(lon1)], with longitudes from 0 to 360, save the response, and open it with xarray.open_dataset.
What resolution is OISST?
0.25° in latitude and longitude, daily, from September 1981.
What does the zlev dimension in OISST mean?
It is a single depth level of 0 m; select it or squeeze it away before analysis.
Is OISST data final?
Days in the final dataset are; the near-real-time version of the last few weeks is replaced by final values about two weeks later.