
How to Animate Points on a Map With Plotly in Python
On this page
Problem statement
A map of a year of events hides the order in which they happened. An animated map, with a play button and a slider stepping through months or days, shows sequences, seasons and spreading patterns that a static map flattens. Plotly Express builds one from a DataFrame with a single extra argument, animation_frame, but the defaults trip people up: frames sorted alphabetically instead of chronologically, colour ranges and marker sizes that jump from frame to frame, and frames with no data that vanish from the slider.
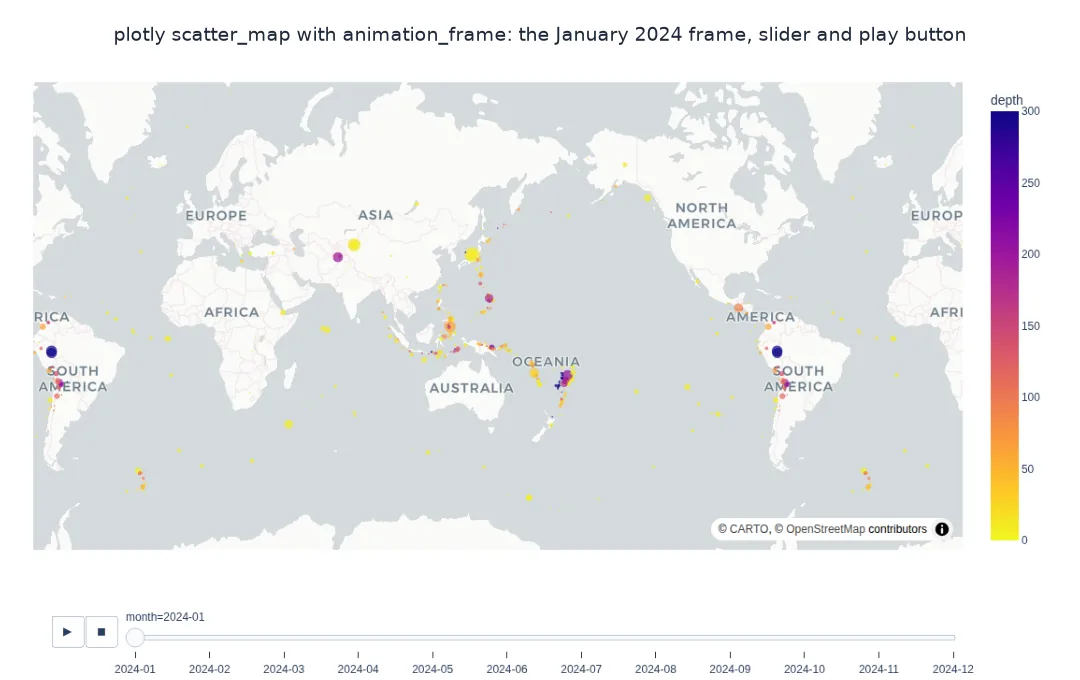
This page animates every magnitude 4.5 and larger earthquake of 2024 from the USGS catalogue month by month with plotly.express.scatter_map, fixes the frame order and the colour range, adds cumulative frames that keep earlier events visible, and counts what each frame contains.
Quick answer
Give animation_frame a column that sorts in the right order, and fix the colour range so it does not change between frames:
import plotly.express as px
fig = px.scatter_map(Q, lat="latitude", lon="longitude", animation_frame="month", color="depth", size="size", size_max=12,
                     range_color=(0, 300), color_continuous_scale="Plasma_r", zoom=0.6, center={"lat": 10, "lon": 150},
                     map_style="carto-positron", hover_name="place", category_orders={"month": MONTHS})
fig.update_layout(margin=dict(l=0, r=0, t=0, b=0))
fig.write_html("data/quakes_by_month.html", include_plotlyjs="cdn")
print(f"frames: {len(fig.frames)}; first {fig.frames[0].name}, last {fig.frames[-1].name}; HTML {Path('data/quakes_by_month.html').stat().st_size / 1e6:.2f} MB")
frames: 12; first 2024-01, last 2024-12; HTML 0.57 MB
The animation has 12 frames in order, January to December, and the HTML file is 0.57 MB.
Frame order, frame contents, cumulative frames
1. Frame order
Frames follow the order in which values first appear, or category_orders if given. A month name column without it can start anywhere; zero-padded YYYY-MM strings sort correctly on their own:
by_name = Q.time.dt.strftime("%B")
print("first appearance order of month names:", list(dict.fromkeys(by_name))[:4], "...")
print("sorted month names:", sorted(by_name.unique())[:4], "... (alphabetical, wrong)")
print("frame names from the figure:", [f.name for f in fig.frames][:4], "...")
first appearance order of month names: ['January', 'February', 'March', 'April'] ...
sorted month names: ['April', 'August', 'December', 'February'] ... (alphabetical, wrong)
frame names from the figure: ['2024-01', '2024-02', '2024-03', '2024-04'] ...
Month names happen to appear in order here because the data is sorted by time, but sorted alphabetically they start with April, August, December. The YYYY-MM frame names avoid both traps.
2. What each frame holds
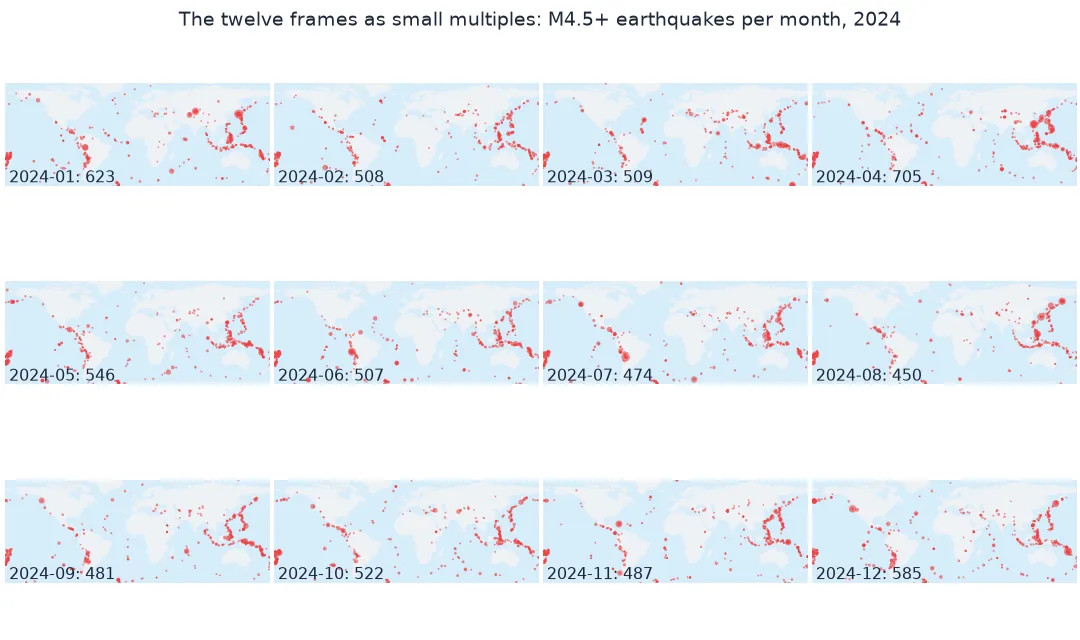
Count the events and the largest magnitude per month, so the animation can be read against numbers:
per = Q.groupby("month").agg(events=("mag", "size"), largest=("mag", "max"), m6=("mag", lambda m: (m >= 6).sum()))
print(per.to_string())
print(f"busiest month: {per.events.idxmax()} ({per.events.max()}); quietest: {per.events.idxmin()} ({per.events.min()})")
events largest m6
month
2024-01 623 7.5 12
2024-02 508 6.3 4
2024-03 509 6.9 8
2024-04 705 7.4 12
2024-05 546 6.6 8
2024-06 507 7.2 7
2024-07 474 7.4 9
2024-08 450 7.1 10
2024-09 481 6.5 8
2024-10 522 6.6 7
2024-11 487 6.8 5
2024-12 585 7.3 9
busiest month: 2024-04 (705); quietest: 2024-08 (450)
April was the busiest month, 705 events, 172 of them in the Hualien sequence in eastern Taiwan; August the quietest, 450. Every month had at least four earthquakes of M6 or more.
3. Cumulative frames
To show the year building up, repeat each event in every later frame. The data grows, so check the file size:
cum = pd.concat([Q[Q.month <= m].assign(frame=m) for m in MONTHS], ignore_index=True)
f2 = px.scatter_map(cum, lat="latitude", lon="longitude", animation_frame="frame", color="depth", range_color=(0, 300),
                    color_continuous_scale="Plasma_r", size="size", size_max=12, zoom=0.6, center={"lat": 10, "lon": 150}, map_style="carto-positron")
f2.write_html("data/quakes_cumulative.html", include_plotlyjs="cdn")
print(f"rows: {len(Q):,} events -> {len(cum):,} in cumulative frames; HTML {Path('data/quakes_cumulative.html').stat().st_size / 1e6:.2f} MB")
rows: 6,397 events -> 42,559 in cumulative frames; HTML 2.03 MB
Cumulative frames repeat each event in every later month, multiplying the rows 6.7 times to 42,559 and the file to 2.03 MB.
Frame speed and the slider
The data used on this page
Every earthquake of magnitude 4.5 or more worldwide in 2024 from the USGS FDSN event service, as CSV, with a YYYY-MM month column for the frames.
from pathlib import Path

import numpy as np
import pandas as pd
import requests

Path("data").mkdir(exist_ok=True)
p = Path("data/quakes_m45_2024.csv")
if not p.exists():
    r = requests.get("https://earthquake.usgs.gov/fdsnws/event/1/query", timeout=600,
                     params=dict(format="csv", starttime="2024-01-01", endtime="2025-01-01", minmagnitude=4.5, orderby="time-asc"))
    r.raise_for_status()
    p.write_bytes(r.content)
Q = pd.read_csv(p)
Q = Q[Q["type"] == "earthquake"].reset_index(drop=True)
Q["time"] = pd.to_datetime(Q.time)
Q["month"] = Q.time.dt.strftime("%Y-%m")
Q["size"] = (Q.mag - 4) ** 2
MONTHS = sorted(Q.month.unique())
print(f"{len(Q):,} earthquakes of M4.5+ in 2024 across {len(MONTHS)} months")
6,397 earthquakes of M4.5+ in 2024 across 12 months
The 6,397 earthquakes fall in 12 months, each a frame.
Example 1: frame speed and the slider
The play button's speed is set in the layout's update menus. Slow it down and check the settings:
fig.layout.updatemenus[0].buttons[0].args[1]["frame"]["duration"] = 900
fig.layout.updatemenus[0].buttons[0].args[1]["transition"]["duration"] = 300
fig.write_html("data/quakes_by_month.html", include_plotlyjs="cdn")
print(f"frame duration {fig.layout.updatemenus[0].buttons[0].args[1]['frame']['duration']} ms; slider steps {len(fig.layout.sliders[0].steps)}")
frame duration 900 ms; slider steps 12
Each frame now shows for 900 ms; the slider has a step per month.
An animation is a list of frames
Plotly builds an animation as a list of frames, one per unique value of animation_frame, each holding the data for that value, plus a slider and play buttons that step through them. Plotly Express takes the frame order from the order in which values first appear in the data, unless category_orders sets it, which is why month names, weekday names and unsorted data produce scrambled animations. Zero-padded strings such as 2024-03 sort chronologically and avoid the problem; real dates work too but produce long frame labels.
Consistency between frames is what makes an animation readable. A colour range computed per frame changes the meaning of each colour as the animation plays; fixing range_color keeps it constant. The same applies to marker size and to the view: a fixed center and zoom keep the map still while the data changes. All frames are embedded in the HTML, so cumulative animations, which repeat events in every later frame, multiply the data roughly by half the number of frames: 6.7 times for 12 monthly frames here.
Empty frames, animation groups and video export
- Empty frames: a value with no rows produces no frame; add explicit empty rows or accept the gap in the slider.
- animation_group: links the same object across frames for smooth movement, such as a vehicle ID; events need none.
- Very many frames: daily frames over years make large files and a slider too fine to use; aggregate.
- Export to video: Plotly has no direct video export; render frames to images or use matplotlib's animation tools.
Internal links
- How to plot points on an interactive map with Plotly in Python — the static version
- How to animate an earthquake sequence in Python — a matplotlib animation
- Fixing USGS earthquake times that show up as 1970 — the timestamps behind the frames
FAQ
How do I make an animated map in Plotly?
Add animation_frame="column" to px.scatter_map or px.choropleth_map; each unique value becomes a frame with a play button and a slider.
Why is my Plotly animation in the wrong order?
Frames follow the order values first appear; sort the data, use zero-padded YYYY-MM strings or set category_orders.
How do I stop colours changing between frames?
Set range_color=(min, max) so every frame uses the same colour scale.
How do I change the animation speed?
Edit fig.layout.updatemenus[0].buttons[0].args[1]["frame"]["duration"], in milliseconds.