
Population Grids Explained
On this page
Problem statement
A population grid looks like any other raster: a number in each cell. The number can mean very different things. In a census grid it is the residents registered at addresses inside the cell. In a modelled grid such as GHS-POP or WorldPop it is a share of an administrative unit's population, placed in the cell by a model because of what satellites see there. Two grids of the same place and year can agree on the total and disagree about almost every cell, and the right one depends on the question.
This page lines up the three kinds for the Netherlands in 2020: Statistics Netherlands' 100 m census squares, GHS-POP at 30 arc-seconds, and WorldPop R2025A at 3 arc-seconds. It shows what their cell values are, where their totals come from, how differently they concentrate people, and how much a simple question depends on the choice.
Quick answer
Load the three and summarise them side by side:
T = pd.DataFrame({name: {"kind": kind, "cell": cell, "cells with people": int((v > 0).sum()), "total": v.sum(), "largest cell": v.max()}
                  for name, (kind, cell, v) in GRIDS.items()}).T
print(T.to_string(formatters={"cells with people": "{:,}".format, "total": "{:,.0f}".format, "largest cell": "{:,.0f}".format}))
print(f"official population, 1 January 2020: {OFFICIAL:,}")
kind cell cells with people total largest cell
census register, bottom up 100 m 379,905 16,740,785 2,180
GHS-POP model, top down 30 arc-sec 61,465 17,389,161 11,407
WorldPop model, top down 3 arc-sec 3,527,556 17,589,165 65
official population, 1 January 2020: 17,407,585
The three grids describe the same 17.4 million people with very different cells: 379,905 census squares with up to 2,180 residents, 61,465 GHS-POP cells with up to 11,407, and 3.5 million WorldPop cells with at most 65. Their totals differ by up to 850,000 people.
What a cell value is, where totals come from, concentration
1. What a cell value is
Look at the smallest positive values and whether the values are whole numbers:
for name, (kind, cell, v) in GRIDS.items():
    pos = v[v > 0]
    print(f"{name:>8}: smallest {pos.min():.2g}; whole numbers {np.mean(pos == np.round(pos)):.0%}; under one person {np.mean(pos < 1):.0%} of cells")
print(f"census values that are multiples of 5: {np.mean(cbs[cbs > 0] % 5 == 0):.0%}")
census: smallest 5; whole numbers 100%; under one person 0% of cells
GHS-POP: smallest 0.00015; whole numbers 0%; under one person 5% of cells
WorldPop: smallest 3e-06; whole numbers 0%; under one person 42% of cells
census values that are multiples of 5: 100%
Every census value is a whole number, a multiple of five and at least five. The modelled values are never whole: GHS-POP's smallest is 0.00015 people and WorldPop's 0.000003, and 42% of WorldPop's populated cells hold less than one person. These are densities expressed per cell, not head counts.
2. Where the totals come from
A modelled grid is scaled to administrative counts, so its total is close to the official figure by design; a census grid is the sum of what could be published:
for name, (kind, cell, v) in GRIDS.items():
    print(f"{name:>8} ({kind}): {v.sum():>12,.0f}  {v.sum() / OFFICIAL - 1:+.1%} against the register")
census (register, bottom up): 16,740,785 -3.8% against the register
GHS-POP (model, top down): 17,389,161 -0.1% against the register
WorldPop (model, top down): 17,589,165 +1.0% against the register
The models land within about 1% of the register, GHS-POP 0.1% below and WorldPop 1.0% above, because each is scaled to administrative counts. The census grid, the only one that counts people individually, is the furthest off, 3.8% short, because of what confidentiality keeps out of it.
3. How concentrated each one is
Put all three on equal footing by area: what share of people live in the densest 1% and 10% of the land, measured with each grid's own cell areas:
for name, (kind, cell, v) in GRIDS.items():
    a = AREAS[name]
    d = v / a
    o = np.argsort(d)[::-1]
    cum_area = np.cumsum(a[o]) / LAND_KM2
    cum_pop = np.cumsum(v[o]) / v.sum()
    print(f"{name:>8}: densest 1% of land holds {np.interp(0.01, cum_area, cum_pop):.0%} of people, densest 10% holds {np.interp(0.10, cum_area, cum_pop):.0%}")
census: densest 1% of land holds 30% of people, densest 10% holds 99%
GHS-POP: densest 1% of land holds 17% of people, densest 10% holds 72%
WorldPop: densest 1% of land holds 16% of people, densest 10% holds 73%
In the census, the densest 1% of the land holds 30% of the people, and all published residents fit on about a tenth of the land, because squares with no or very few residents are absent. The models put only 16% to 17% of people on the densest 1%, and need nearly three quarters of the densest tenth: they spread people more thinly over more land.
One question, three answers
The data used on this page
The CBS 100 m grid, final 2020 edition; GHS-POP R2023A epoch 2020 at 30 arc-seconds (tile R4_C19); WorldPop R2025A constrained 2020; the land boundary from the PDOK CBS gebiedsindelingen web feature service; and the population on 1 January 2020 from StatLine table 03759ned.
import io
import json
import zipfile
from pathlib import Path

import geopandas as gpd
import numpy as np
import pandas as pd
import pyogrio
import rasterio
import requests
from pyproj import Geod, Transformer
from rasterio.mask import mask

Path("data").mkdir(exist_ok=True)
name = "GHS_POP_E2020_GLOBE_R2023A_4326_30ss"
GHS = Path("data", f"{name}_V1_0_R4_C19.tif")
if not GHS.exists():
    url = f"https://jeodpp.jrc.ec.europa.eu/ftp/jrc-opendata/GHSL/GHS_POP_GLOBE_R2023A/{name}/V1-0/tiles/{GHS.stem}.zip"
    zipfile.ZipFile(io.BytesIO(requests.get(url, timeout=600).content)).extract(GHS.name, "data")
WP = Path("data/nld_pop_2020_CN_100m_R2025A_v1.tif")
if not WP.exists():
    WP.write_bytes(requests.get("https://data.worldpop.org/GIS/Population/Global_2015_2030/R2025A/2020/NLD/v1/100m/constrained/"
                                "nld_pop_2020_CN_100m_R2025A_v1.tif", timeout=600).content)
GPKG = Path("data/cbs_vk100_2020_vol.gpkg")
if not GPKG.exists():
    url = "https://www.cbs.nl/-/media/cbs/dossiers/nederland-regionaal/vierkanten/100/2023-cbs_vk100_2020_vol.zip"
    zipfile.ZipFile(io.BytesIO(requests.get(url, timeout=900).content)).extract(GPKG.name, "data")
B = Path("data/landsdeel_2020.geojson")
if not B.exists():
    B.write_bytes(requests.get("https://service.pdok.nl/cbs/gebiedsindelingen/2020/wfs/v1_0", timeout=300, params={
        "service": "WFS", "version": "2.0.0", "request": "GetFeature", "typeName": "gebiedsindelingen:landsdeel_gegeneraliseerd",
        "outputFormat": "application/json", "srsName": "EPSG:28992"}).content)
C = Path("data/cbs_pop_2020.json")
if not C.exists():
    C.write_bytes(requests.get("https://opendata.cbs.nl/ODataApi/odata/03759ned/TypedDataSet", timeout=300, params={
        "$filter": "Geslacht eq 'T001038' and Leeftijd eq '10000' and BurgerlijkeStaat eq 'T001019' and Perioden eq '2020JJ00' "
                   "and (substring(RegioS,0,2) eq 'GM' or substring(RegioS,0,2) eq 'NL')",
        "$select": "RegioS,BevolkingOp1Januari_1"}).content)
OFFICIAL = next(r["BevolkingOp1Januari_1"] for r in json.loads(C.read_text())["value"] if r["RegioS"].startswith("NL"))
NL = gpd.read_file(B).dissolve()
LAND_KM2 = NL.area.iloc[0] / 1e6
geod = Geod(ellps="WGS84")
def latlon(path):
    """Cells inside the country: values, cell areas in km2 and centres in RD New."""
    with rasterio.open(path) as src:
        a, tf = mask(src, NL.to_crs(src.crs).geometry, crop=True, filled=False)
    a = a[0]
    rows = np.array([abs(geod.polygon_area_perimeter([0, tf.a, tf.a, 0], [la, la, la + tf.e, la + tf.e])[0]) / 1e6
                     for la in tf.f + tf.e * np.arange(a.shape[0])])
    r, c = np.nonzero(~a.mask)
    x, y = rasterio.transform.xy(tf, r, c)
    X, Y = Transformer.from_crs(4326, 28992, always_xy=True).transform(np.asarray(x), np.asarray(y))
    v = a.data[r, c].astype("float64")
    return np.where(v > 0, v, 0), rows[r], np.c_[X, Y]
ghs, ghs_a, ghs_xy = latlon(GHS)
wp, wp_a, wp_xy = latlon(WP)
V = pyogrio.read_dataframe(GPKG, columns=["crs28992res100m", "aantal_inwoners"], read_geometry=False)
cbs = V.aantal_inwoners.clip(lower=0).to_numpy("float64")
cbs_xy = V.crs28992res100m.str.extract(r"E(\d+)N(\d+)").astype(int).to_numpy() * 100 + 50
GRIDS = {"census": ("register, bottom up", "100 m", cbs), "GHS-POP": ("model, top down", "30 arc-sec", ghs), "WorldPop": ("model, top down", "3 arc-sec", wp)}
AREAS = {"census": np.full(cbs.size, 0.01), "GHS-POP": ghs_a, "WorldPop": wp_a}
XY = {"census": cbs_xy, "GHS-POP": ghs_xy, "WorldPop": wp_xy}
print(f"land {LAND_KM2:,.0f} km2; cells: census {cbs.size:,}, GHS-POP {ghs.size:,}, WorldPop {wp.size:,}")
land 35,085 km2; cells: census 383,061, GHS-POP 66,493, WorldPop 3,540,282
The land boundary covers 35,085 km². The census file has 383,061 squares, the GHS-POP clip 66,493 cells and the WorldPop clip 3,540,282.
Example 1: one question, three answers
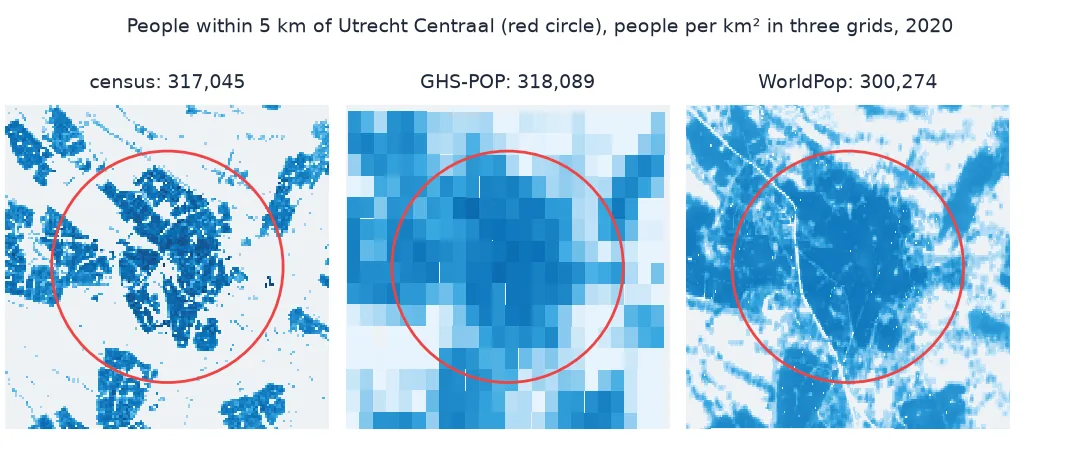
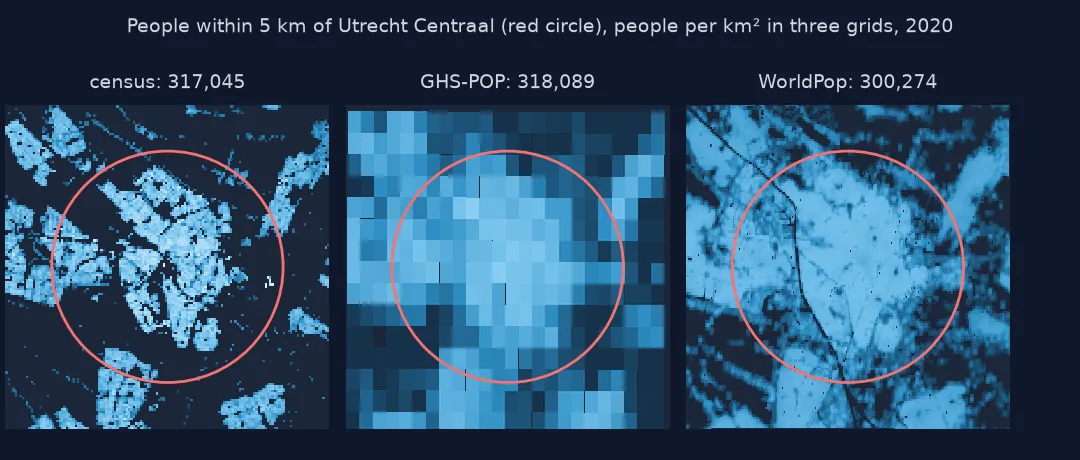
How many people live within 5 km of Utrecht Centraal station? Count the cells whose centres fall inside the circle:
x0, y0 = Transformer.from_crs(4326, 28992, always_xy=True).transform(5.1100, 52.0894)
for name in GRIDS:
    xy, v = XY[name], GRIDS[name][2]
    inside = np.hypot(xy[:, 0] - x0, xy[:, 1] - y0) <= 5_000
    print(f"{name:>8}: {v[inside].sum():>9,.0f} people within 5 km ({inside.sum():,} cells)")
census: 317,045 people within 5 km (3,191 cells)
GHS-POP: 318,089 people within 5 km (148 cells)
WorldPop: 300,274 people within 5 km (13,676 cells)
Within 5 km of Utrecht Centraal, the census counts 317,045 residents and GHS-POP 318,089, within 0.3% of each other; WorldPop gives 300,274, 5% fewer. For a circle this size the choice of grid changes the answer by a few percent; for single 1 km cells, the cell-by-cell comparison finds most off by more than half.
Bottom-up and top-down grids
There are two ways to make a population grid. Bottom up, a statistical office counts registered residents at geocoded addresses and sums them into cells; the cells are exact where published, but confidentiality rules drop and round small counts, and only countries with address registers can do it. Top down, a model takes the population of each administrative unit, from a census or register, and spreads it over the unit's cells in proportion to covariates seen from above: built-up area and volume for GHS-POP, a random forest on buildings, lights, land cover and more for WorldPop. Every country can be covered this way, at the price that the pattern inside each unit is an estimate.
Those two origins explain everything on this page. The modelled totals sit near the official count because they are scaled to it; the census total sits below because of what cannot be published. The models' cells hold fractions of people because a share of a unit is not a head count. And the models concentrate people less than the census, because a satellite sees floor space more easily than it sees how many people share it. A grid's resolution, CRS and epoch matter too, but its origin matters most.
Residents, epochs and licences
- Residents, not people present: all three count where people sleep; daytime and ambient population products, such as LandScan, answer a different question.
- Epochs: GHS-POP and WorldPop also publish projections for years after their inputs; a 2025 grid may be a forecast.
- Resolution is not accuracy: WorldPop's 3 arc-second cells are finer than GHS-POP's 30 arc-second cells, but finer cells of a model are not automatically closer to the census.
- Licences: CBS, GHSL and WorldPop data are open for reuse with attribution, under each publisher's terms.
Internal links
- How to compare population grids cell by cell in Python — the comparison at 1 km
- How to use a census population grid in Python — the bottom-up grid
- Population grid accuracy explained — what the differences mean
FAQ
What is a population grid?
A raster in which each cell holds the number of people living in it, either counted from registers (a census grid) or estimated by distributing administrative counts with a model (GHS-POP, WorldPop).
What is the difference between GHSL and WorldPop?
Both are top-down models; GHS-POP distributes census counts by built-up volume mapped by the GHSL, WorldPop by a random forest on many covariates, and they differ in resolution, inputs and epochs.
Why does a population grid have fractions of people?
Because modelled grids give each cell a share of a unit's population; 0.3 in a cell is a density, not a person.
Which population grid should I use?
A census grid where one exists and its suppression does not matter for the question; otherwise a modelled grid, checked against official counts for the areas being analysed.