
Fixing a Census Grid Total That Comes Out Below the Official Population
On this page
Problem statement
The squares of a census population grid are summed for a country, a municipality or a study area, and the total comes out lower than the official population. Nothing in the code is wrong: no squares were lost, no suppression code was summed. The Statistics Netherlands (CBS) 100 m grid for 2020 adds up to 16,740,785 residents against an official 17,407,585 on the same date, and every municipality comes out short.
This page measures the shortfall, shows where it comes from, and rescales the grid to official municipal totals when an analysis needs the totals to match.
Quick answer
Join the squares to the units the official figures use, compare, and rescale each unit's squares by its official-to-grid ratio:
G = SQ.groupby("statcode").residents.sum().to_frame("grid").join(OFF.rename("official"))
G["short"] = G.official - G.grid
print(f"grid {G.grid.sum():,.0f}, official {G.official.sum():,}: short {G.short.sum():,.0f} ({G.short.sum() / G.official.sum():.1%})")
print(f"municipalities short: {(G.short > 0).sum()} of {len(G)}")
SQ["scaled"] = SQ.residents * SQ.statcode.map(G.official / G.grid)
print(f"after rescaling: {SQ.scaled.sum():,.0f}")
grid 16,736,790, official 17,407,585: short 670,795 (3.9%)
municipalities short: 355 of 355
after rescaling: 17,407,585
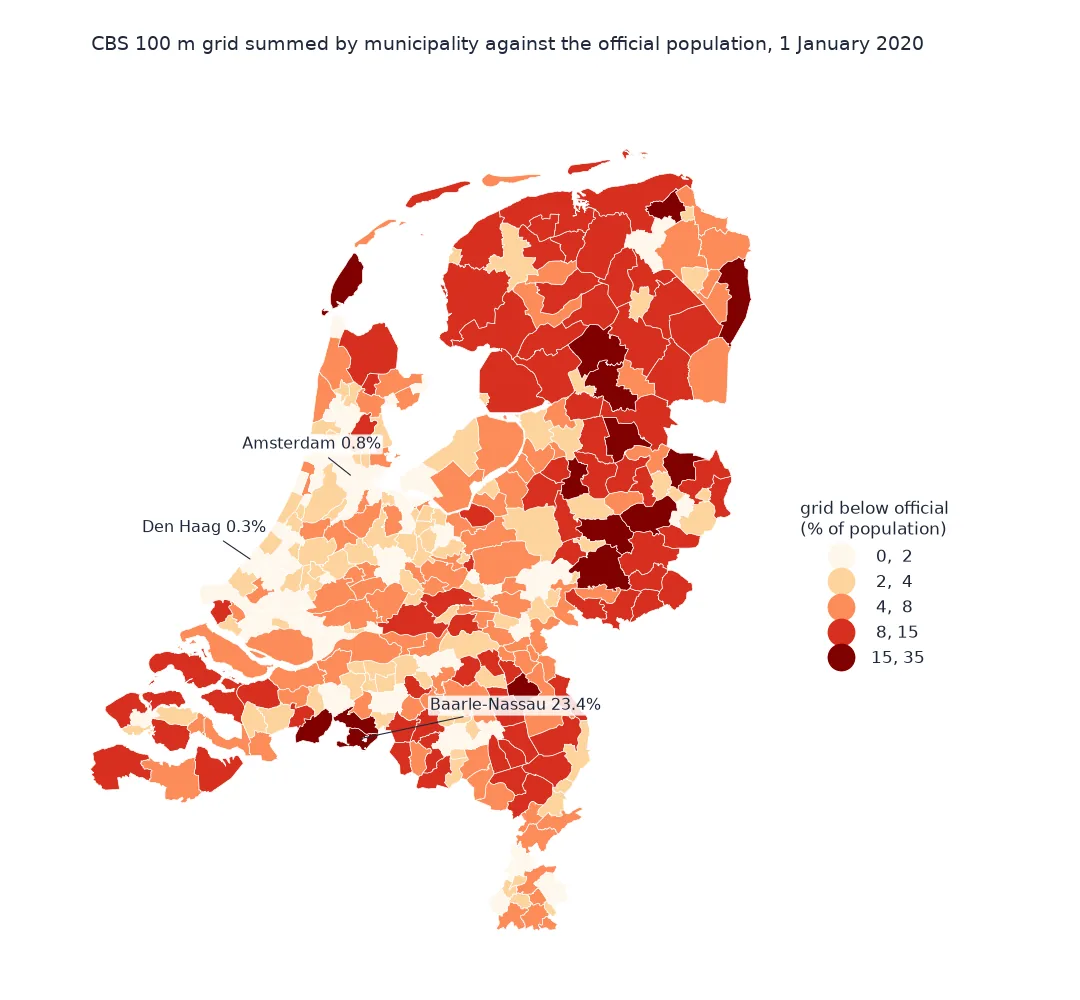
Joined to the 355 municipalities, the squares hold 16,736,790 residents, 670,795 or 3.9% below the official figures, and all 355 municipalities are short. Rescaling each municipality's squares by its own ratio brings the total to the official 17,407,585.
Rule out the code, measure the shortfall, see where it hurts
1. Rule out the code
Check that every square was read, that the suppression code was masked, and that nothing was double counted in the join:
print(f"squares read: {len(V):,}; joined to a municipality: {len(SQ):,}; joined twice: {SQ.index.duplicated().sum()}")
print(f"residents in squares outside every municipality: {V.residents.sum() - SQ.residents.sum():,.0f}")
print(f"negative values left: {(SQ.residents < 0).sum()}; suppressed resident counts: {V.aantal_inwoners.eq(-99997).sum():,}")
squares read: 383,061; joined to a municipality: 382,850; joined twice: 0
residents in squares outside every municipality: 3,995
negative values left: 0; suppressed resident counts: 3,156
All 383,061 squares were read and none was joined twice. 211 squares with 3,995 residents have centres outside the generalised land boundaries, on the coast and along the borders; that is why the joined total is 3,995 below the 16,740,785 of the whole file. No negative values are left. The code is not the problem.
2. Measure the shortfall per square
If the gap came from a few missing places it would sit in a few municipalities. It does not: divide each municipality's shortfall by its number of published squares:
G["squares"] = SQ.groupby("statcode").size()
G["per_square"] = G.short / G.squares
q = G.per_square.quantile([0.1, 0.5, 0.9])
print(f"shortfall per published square: mean {G.short.sum() / G.squares.sum():.2f}; "
      f"10th-90th percentile across municipalities {q[0.1]:.2f} to {q[0.9]:.2f}")
print(f"smallest shortfall: {G.short.min():,.0f} people; largest: {G.short.max():,.0f}")
shortfall per published square: mean 1.75; 10th-90th percentile across municipalities 0.75 to 3.18
smallest shortfall: 34 people; largest: 7,735
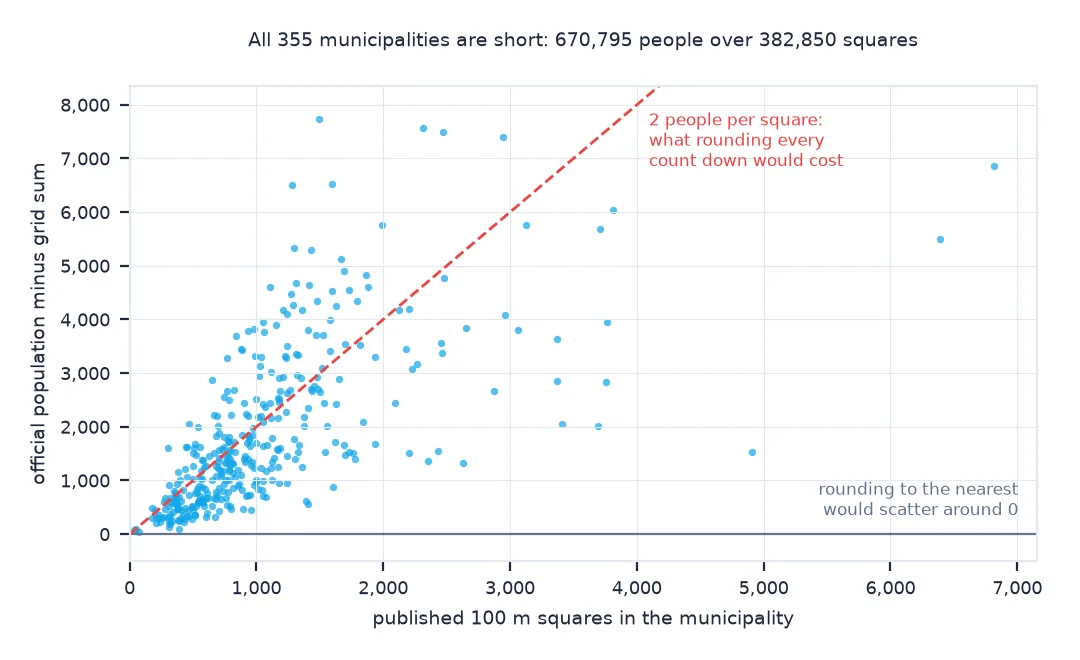
Across all municipalities the shortfall is 1.75 people per published square, and in most of them between 0.75 and 3.18. Even the smallest gap is 34 people, and the largest 7,735. A shortfall spread thinly over every square points to the publication rules, not to missing places.
3. Where it hurts most
The shortfall as a share of population is larger where squares hold few people each:
G["share"] = G.short / G.official
G["per_sq_pop"] = G.grid / G.squares
G["band"] = pd.qcut(G.per_sq_pop, 4, labels=["fewest per square", "2nd", "3rd", "most per square"])
print(G.groupby("band", observed=True).agg(municipalities=("share", "size"), people_per_square=("per_sq_pop", "median"),
                                           short=("share", "median")).round(3).to_string())
municipalities people_per_square short
band
fewest per square 89 22.940 0.106
2nd 89 29.388 0.060
3rd 88 41.423 0.032
most per square 89 59.505 0.014
In the quarter of municipalities whose squares hold the fewest people, a median of 23 each, the grid is 10.6% short; in the quarter with the most, a median of 60, it is 1.4% short. Rural municipalities lose most, because more of their homes sit in small squares that are dropped, and rounding takes a bigger bite out of small counts.
Rescaling, and what it does
The data used on this page
The CBS 100 m grid, final 2020 edition, the 2020 municipality boundaries from the PDOK CBS gebiedsindelingen web feature service, and the population of each municipality on 1 January 2020 from StatLine table 03759ned.
import io
import json
import zipfile
from pathlib import Path

import geopandas as gpd
import pandas as pd
import pyogrio
import requests

Path("data").mkdir(exist_ok=True)
GPKG = Path("data/cbs_vk100_2020_vol.gpkg")
if not GPKG.exists():
    url = "https://www.cbs.nl/-/media/cbs/dossiers/nederland-regionaal/vierkanten/100/2023-cbs_vk100_2020_vol.zip"
    zipfile.ZipFile(io.BytesIO(requests.get(url, timeout=900).content)).extract(GPKG.name, "data")
B = Path("data/gemeente_2020.geojson")
if not B.exists():
    B.write_bytes(requests.get("https://service.pdok.nl/cbs/gebiedsindelingen/2020/wfs/v1_0", timeout=300, params={
        "service": "WFS", "version": "2.0.0", "request": "GetFeature", "typeName": "gebiedsindelingen:gemeente_gegeneraliseerd",
        "outputFormat": "application/json", "srsName": "EPSG:28992"}).content)
GM = gpd.read_file(B)
C = Path("data/cbs_pop_2020.json")
if not C.exists():
    C.write_bytes(requests.get("https://opendata.cbs.nl/ODataApi/odata/03759ned/TypedDataSet", timeout=300, params={
        "$filter": "Geslacht eq 'T001038' and Leeftijd eq '10000' and BurgerlijkeStaat eq 'T001019' and Perioden eq '2020JJ00' "
                   "and (substring(RegioS,0,2) eq 'GM' or substring(RegioS,0,2) eq 'NL')",
        "$select": "RegioS,BevolkingOp1Januari_1"}).content)
OFF = pd.Series({r["RegioS"].strip(): r["BevolkingOp1Januari_1"] for r in json.loads(C.read_text())["value"]
                 if r["RegioS"].startswith("GM") and r["BevolkingOp1Januari_1"]})
V = pyogrio.read_dataframe(GPKG, columns=["crs28992res100m", "aantal_inwoners"], read_geometry=False)
V["residents"] = V.aantal_inwoners.where(V.aantal_inwoners >= 0, 0)
xy = V.crs28992res100m.str.extract(r"E(\d+)N(\d+)").astype(int) * 100 + 50          # square centres
pts = gpd.GeoDataFrame(V, geometry=gpd.points_from_xy(xy[0], xy[1]), crs=28992)
SQ = pts.sjoin(GM[["statcode", "geometry"]], predicate="within").drop(columns="index_right")
print(f"{len(V):,} squares; {len(GM)} municipalities with boundaries, {len(OFF)} with a 2020 population")
383,061 squares; 355 municipalities with boundaries, 355 with a 2020 population
The file has 383,061 squares; boundaries and 2020 populations match for all 355 municipalities.
Example 1: rescale, and know what it does
Rescaling makes every municipality add up, but it puts the missing people in published squares, in proportion to who is already there:
G["factor"] = G.official / G.grid
lo, hi = G.factor.idxmin(), G.factor.idxmax()
name = GM.set_index("statcode").statnaam
print(f"scaling factors {G.factor.min():.3f} ({name[lo]}) to {G.factor.max():.3f} ({name[hi]}), median {G.factor.median():.3f}")
check = SQ.groupby("statcode").scaled.sum().sub(G.official).abs().max()
print(f"largest municipal difference after rescaling: {check:.6f} people")
scaling factors 1.003 ('s-Gravenhage) to 1.305 (Baarle-Nassau), median 1.047
largest municipal difference after rescaling: 0.000000 people
The factors run from 1.003 for Den Haag, where squares are full, to 1.305 for Baarle-Nassau: a rural municipality whose Dutch enclaves inside Belgium the generalised boundary mostly leaves out, so some of its published squares are not even assigned to it. The median factor is 1.047, and after rescaling every municipality matches exactly.
Two publication rules take people out
Two publication rules take people out. CBS publishes a 100 m square only if it has at least five residents or at least five dwellings, so homes in squares below both thresholds, an isolated farm, a lock-keeper's house, a handful of houses on a dike, are not in the file at all. And every published count is a multiple of five. The mean shortfall of 1.75 people per published square is close to the 2 that rounding every count down to a multiple of five would produce, and far from the zero that rounding to the nearest multiple would average; the dropped squares add the rest. CBS does not attach a total of what was withheld, which is why the official municipal figures are the only way to measure it.
Whether to rescale depends on the question. For totals by area, densities and rates, rescaling to official figures is better than a 3.9% undercount that is larger in rural areas. For anything about where people are within a municipality, rescaling moves the dropped rural households into the published squares, mostly in villages and towns, which is the opposite of where they live. Report which one was done.
Boundary vintage and squares on boundaries
- Boundary vintage: the official figures are for the municipalities of the same year; join the squares to the boundaries of that year, not the current ones.
- Squares on a boundary: assigning each square by its centre puts all its residents in one municipality; for small units, that alone can move a few percent.
- Age bands: the age columns are suppressed far more often than the total, so their sums fall shorter still; rescale them separately, against the official totals by age.
- Modelled grids: GHS-POP and WorldPop are scaled to census inputs by design, so they do not show this shortfall; they have larger errors of placement instead.
Internal links
- How to use a census population grid in Python — reading the CBS grid
- How to download and clip the GHSL population grid in Python — a modelled grid that matches totals
- How to suppress small counts in Python — the rules from the publisher's side
FAQ
Why is the sum of the CBS 100 m grid lower than the population?
Squares with fewer than five residents and five dwellings are not published, and published counts are multiples of five; in 2020 the grid is 666,800 people, 3.8%, below the official count.
Should I rescale a census grid to official totals?
For totals, densities and rates by area, yes. For questions about where within an area people live, rescaling moves rural people into towns; leave it, or say what it does.
Is the shortfall the same everywhere?
No. It is largest as a share of the population in municipalities whose squares hold few people each, which are mostly rural.
Do GHSL and WorldPop have the same problem?
No. They are scaled to census or register counts, so their totals for large areas match closely; their errors are in where they put people.