
Fixing Population Totals That Add Up to More Than the Whole
On this page
Problem statement
A population grid is summed for each district, municipality or service area, and the parts add up to more than the country. Or two neighbouring areas are clipped separately and their populations, added, exceed the population of the two together. Nothing is wrong with the grid: the cells on the shared boundaries were counted twice, once for each side. Summed with all_touched=True, GHS-POP gives the 355 Dutch municipalities of 2020 a combined 20.0 million people, in a country of 17.4 million.
This page measures how many cells are counted more than once and where, shows why the inflation is worst for small areas and coarse grids, and fixes it with fractional coverage.
Quick answer
Count each edge cell once, by its centre, or split it by area with exactextract:
touched = [z["sum"] for z in zonal_stats(G4326, str(GHS), stats="sum", all_touched=True)]
fractional = exact_extract(str(GHS), G4326, "sum", output="pandas")["sum"]
print(f"country, clipped once: {NATIONAL:,.0f}")
print(f"sum of municipalities, all touched: {sum(touched):,.0f} ({sum(touched) / NATIONAL - 1:+.1%})")
print(f"sum of municipalities, fractional:  {fractional.sum():,.0f} ({fractional.sum() / NATIONAL - 1:+.2%})")
country, clipped once: 17,389,161
sum of municipalities, all touched: 20,024,203 (+15.2%)
sum of municipalities, fractional: 17,367,314 (-0.13%)
Clipped once, the country holds 17,389,161 people. Summed municipality by municipality with all_touched, it holds 20,024,203, 15.2% more. With fractional coverage the municipalities add up to 17,367,314, within 0.13% of the single clip; the small gap is the coastal and border cells, which the single clip counts whole and fractional coverage counts by their land share.
Count cell reuse, see which areas inflate, check the fix
1. Count how often each cell is used
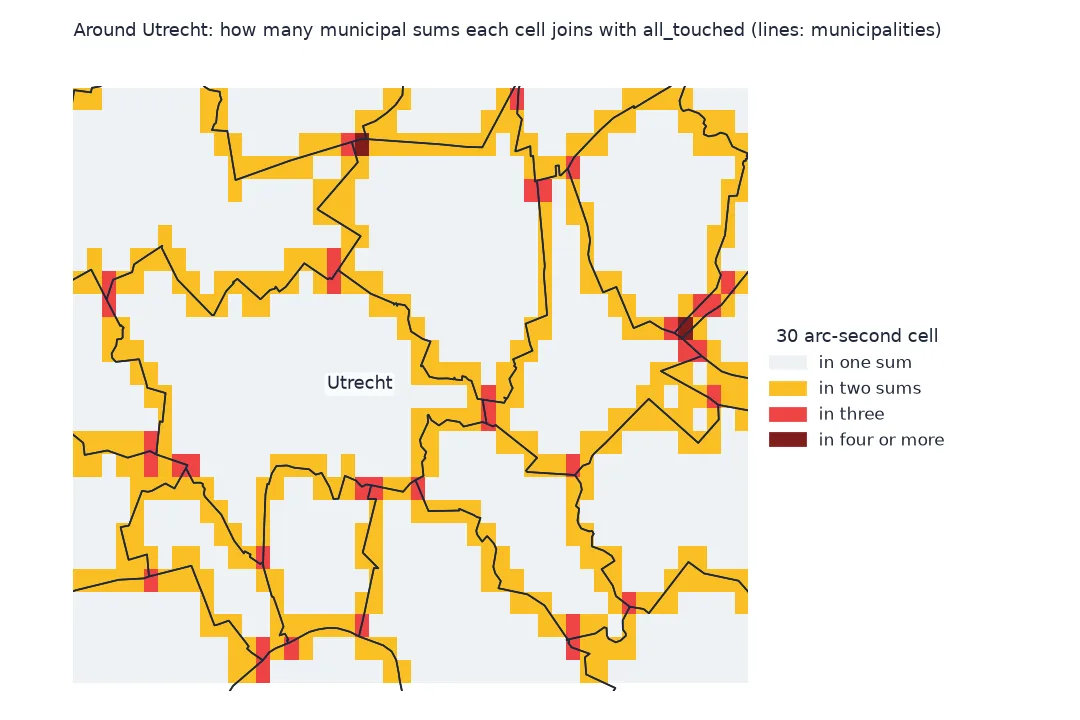
Rasterise every municipality onto the grid with all_touched=True and add up the masks. A cell with a count of 2 or more is in several municipalities' sums:
with rasterio.open(GHS) as src:
    win = rasterio.windows.from_bounds(*G4326.total_bounds, transform=src.transform).round_offsets().round_lengths()
    pop = src.read(1, window=win); tf = src.window_transform(win)
uses = np.zeros(pop.shape, dtype="int16")
for geom in G4326.geometry:
    uses += rasterize([geom], out_shape=pop.shape, transform=tf, all_touched=True, dtype="int16")
for k in range(1, int(uses.max()) + 1):
    print(f"cells used {k} time{'s' if k > 1 else ''}: {(uses == k).sum():>6,}  people in them {pop[uses == k].sum():>12,.0f}")
print(f"people counted more than once: {(pop * np.clip(uses - 1, 0, None)).sum():,.0f}")
cells used 1 time: 56,929 people in them 15,131,952
cells used 2 times: 11,516 people in them 2,197,846
cells used 3 times: 804 people in them 161,071
cells used 4 times: 15 people in them 3,043
cells used 5 times: 1 people in them 223
people counted more than once: 2,530,010
Of the 69,265 cells inside some municipality, 12,336 are used two or more times, 804 of them by three municipalities and one by five. 2,530,010 people are counted more than once, which with the coastal effect accounts for the whole excess.
2. Which areas inflate most
The excess for one municipality is its all-touched sum over its fractional sum. Small municipalities with long boundaries suffer most:
GM["touched"], GM["fractional"] = touched, fractional.to_numpy()
GM["inflation"] = GM.touched / GM.fractional - 1
GM["km2"] = GM.area / 1e6
print(GM.nlargest(4, "inflation")[["statnaam", "km2", "fractional", "inflation"]].to_string(index=False, formatters={
      "km2": "{:,.0f}".format, "fractional": "{:,.0f}".format, "inflation": "{:+.0%}".format}))
print(f"median inflation {GM.inflation.median():+.1%}; correlation with log area {np.corrcoef(np.log(GM.km2), GM.inflation)[0, 1]:.2f}")
statnaam km2 fractional inflation
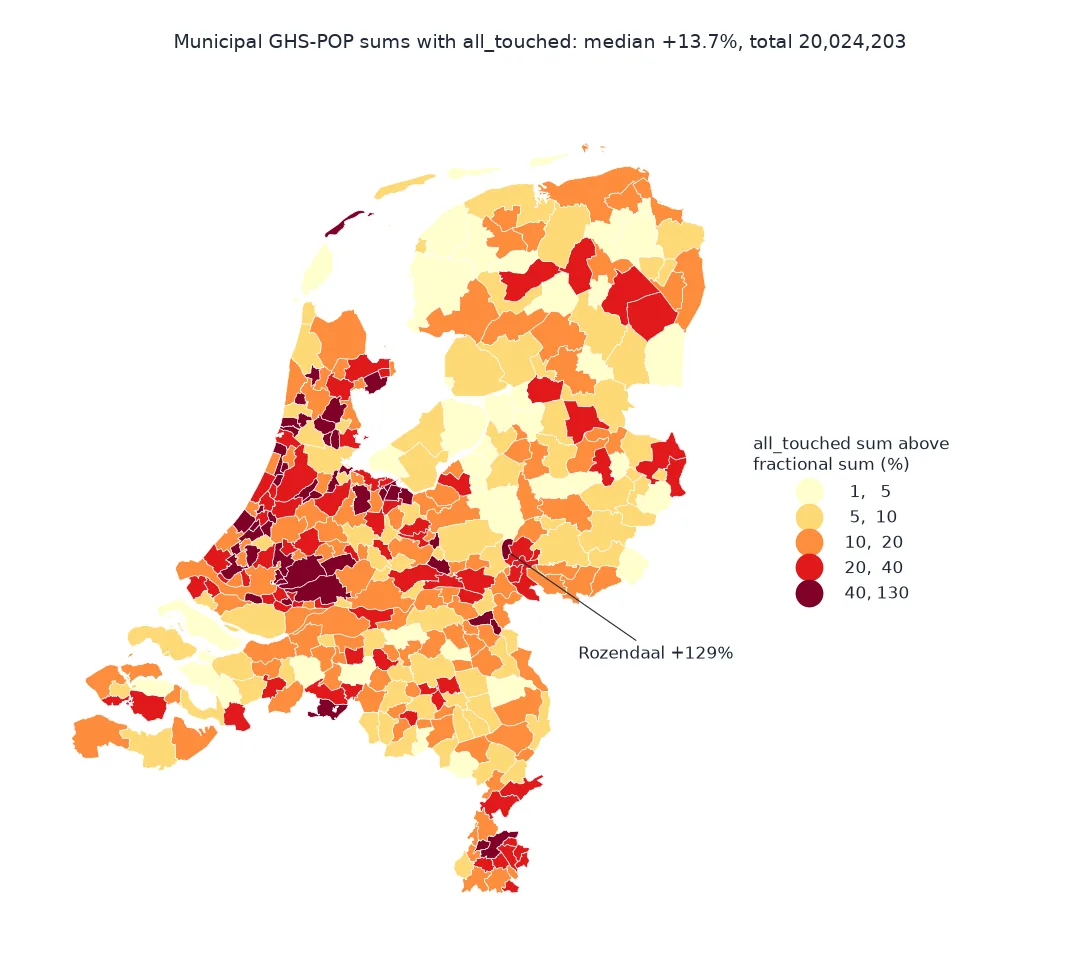
Rozendaal 28 2,473 +129%
Blaricum 11 10,087 +126%
Midden-Delfland 49 22,162 +120%
Wormerland 45 16,972 +119%
median inflation +13.7%; correlation with log area -0.43
Rozendaal, a municipality of 28 km² and 2,473 people by fractional count, more than doubles, and so do Blaricum, Midden-Delfland and Wormerland. The median municipality gains 13.7%. Smaller municipalities inflate more: the correlation between log area and inflation is -0.43.
3. Check that the fix adds up
With fractional coverage, the parts must add up to the whole; check against the country clipped in one piece by the same rule:
whole = exact_extract(str(GHS), NL4326, "sum", output="pandas")["sum"].iloc[0]
print(f"country, fractional: {whole:,.0f}; sum of its municipalities: {fractional.sum():,.0f}; difference {abs(fractional.sum() - whole):.2f} people")
country, fractional: 17,367,314; sum of its municipalities: 17,367,314; difference 0.00 people
With fractional coverage the country clipped in one piece and the sum of its 355 municipalities agree to the person.
Finer cells, smaller excess
The data used on this page
GHS-POP R2023A epoch 2020 at 30 arc-seconds (tile R4_C19), the WorldPop R2025A constrained 2020 raster for the Netherlands, and the 2020 country and municipality boundaries from the PDOK CBS gebiedsindelingen web feature service.
import io
import zipfile
from pathlib import Path

import geopandas as gpd
import numpy as np
import rasterio
import requests
from exactextract import exact_extract
from rasterio.features import rasterize
from rasterio.mask import mask
from rasterstats import zonal_stats

Path("data").mkdir(exist_ok=True)
name = "GHS_POP_E2020_GLOBE_R2023A_4326_30ss"
GHS = Path("data", f"{name}_V1_0_R4_C19.tif")
if not GHS.exists():
    url = f"https://jeodpp.jrc.ec.europa.eu/ftp/jrc-opendata/GHSL/GHS_POP_GLOBE_R2023A/{name}/V1-0/tiles/{GHS.stem}.zip"
    zipfile.ZipFile(io.BytesIO(requests.get(url, timeout=600).content)).extract(GHS.name, "data")
WP = Path("data/nld_pop_2020_CN_100m_R2025A_v1.tif")
if not WP.exists():
    WP.write_bytes(requests.get("https://data.worldpop.org/GIS/Population/Global_2015_2030/R2025A/2020/NLD/v1/100m/constrained/"
                                "nld_pop_2020_CN_100m_R2025A_v1.tif", timeout=600).content)
for layer in ("landsdeel", "gemeente"):
    path = Path("data", f"{layer}_2020.geojson")
    if not path.exists():
        path.write_bytes(requests.get("https://service.pdok.nl/cbs/gebiedsindelingen/2020/wfs/v1_0", timeout=300, params={
            "service": "WFS", "version": "2.0.0", "request": "GetFeature", "typeName": f"gebiedsindelingen:{layer}_gegeneraliseerd",
            "outputFormat": "application/json", "srsName": "EPSG:28992"}).content)
GM = gpd.read_file("data/gemeente_2020.geojson")
NL4326 = gpd.read_file("data/landsdeel_2020.geojson").dissolve().to_crs(4326)
G4326 = GM.to_crs(4326)
with rasterio.open(GHS) as src:
    a, _ = mask(src, NL4326.geometry, crop=True, filled=False)
NATIONAL = float(a.sum())
print(f"{len(GM)} municipalities; GHS-POP 2020 for the country by cell centre: {NATIONAL:,.0f}")
355 municipalities; GHS-POP 2020 for the country by cell centre: 17,389,161
The country clipped by cell centre holds 17,389,161 people in GHS-POP 2020, the reference for the sums below.
Example 1: finer cells, smaller excess
The double-counted band is one cell wide along every boundary, so its share shrinks with the cell size. Compare GHS-POP at 30 arc-seconds with WorldPop at 3 arc-seconds:
for label, path in (("GHS-POP, 30 arc-seconds", GHS), ("WorldPop, 3 arc-seconds", WP)):
    t = sum(z["sum"] or 0 for z in zonal_stats(G4326, str(path), stats="sum", all_touched=True))
    f = exact_extract(str(path), G4326, "sum", output="pandas")["sum"].sum()
    print(f"{label}: all touched {t:,.0f}, fractional {f:,.0f}, excess {t / f - 1:+.1%}")
GHS-POP, 30 arc-seconds: all touched 20,024,203, fractional 17,367,314, excess +15.3%
WorldPop, 3 arc-seconds: all touched 17,812,601, fractional 17,588,014, excess +1.3%
At 3 arc-seconds the excess is 1.3%, against 15.3% at 30 arc-seconds: ten times finer cells, a band one tenth as wide. Still wrong, just less visibly.
What all-touched rasterising does
all_touched=True tells the rasteriser to include every cell the polygon's outline passes through, not just those whose centres fall inside. Along a boundary between two polygons the same cells are touched by both outlines, so every boundary cell joins two sums, and where three municipalities meet, three. The default, cell centre inside, gives each cell to exactly one polygon, so totals add up, but a small polygon can lose or gain whole cells; fractional coverage splits each boundary cell by the share of its area on each side, which adds up and is fair to small polygons.
The size of the excess follows from geometry: it is roughly the boundary length times one cell width times the density there, as a share of the polygon's population. Small polygons have more boundary per person, and coarse cells make the band wider, which is why the excess is 15% for municipalities on a 1 km grid and much less on a 100 m one. all_touched has real uses, a mask that must not miss any cell of a thin feature such as a river, but never a population total.
Mask switches, equal area and uneven spread
rasterio.maskhas the same switch: clipping each polygon separately withmask(..., all_touched=True)double counts in exactly the same way.- Equal area matters for fractions: exactextract computes coverage in the raster's CRS; for 30 arc-second cells in the Netherlands the distortion within one cell is negligible, but not for very large cells near the poles.
- People are not spread evenly: fractional coverage assumes people are spread evenly within each cell; a cell whose people all live on one side of a boundary will still be split by area.
- Overlapping polygons: buffers and service areas that overlap will legitimately count the same people twice; sum them only if double counting is what the question means.
Internal links
- How to sum a population grid by municipality in Python — the totals and their errors
- How to download and clip the GHSL population grid in Python — clipping one area
- Zonal statistics in Python — the general technique
FAQ
Why do my zonal population totals add up to more than the total population?
Edge cells were counted in more than one polygon, usually because of all_touched=True; use cell centres or fractional coverage.
What does all_touched do in rasterio?
It includes every cell that the geometry touches, rather than only cells whose centre lies inside it.
How do I split boundary cells between polygons?
Use exactextract, which weights each cell by the fraction of its area inside each polygon, so the parts add up to the whole.
Does a finer grid fix double counting?
It shrinks it, because the double-counted band is one cell wide, but does not remove it; switch the method.