
Fixing Negative Populations and Values in Census Grid Data
On this page
Problem statement
A census grid is loaded and summarised, and the numbers are impossible: a negative number of men, an average house value of minus 31,000 euros, a share of owner-occupied homes below zero. Maps come out with one colour for everything because a few cells sit at -99,997 and stretch the scale. The values are not errors in the data but codes: Statistics Netherlands writes -99997 where a value is withheld for confidentiality, in the same numeric column as the real values, and every numeric operation treats it as a number.
This page finds every code in the CBS 2020 100 m grid, shows what it does to sums, means and maps, replaces it correctly, and explains why replacing it with zero is nearly as wrong as leaving it in.
Quick answer
Replace the code with a missing value in every numeric column before computing anything:
num = V.select_dtypes("number").columns
clean = V[num].where(V[num] != -99997)
for c in ("aantal_mannen", "gemiddelde_woz_waarde_woning", "percentage_koopwoningen"):
    print(f"{c:>30}: raw mean {V[c].mean():>12,.1f}   cleaned mean {clean[c].mean():>8,.1f}   missing {clean[c].isna().mean():.0%}")
aantal_mannen: raw mean -19,331.9 cleaned mean 26.1 missing 19%
gemiddelde_woz_waarde_woning: raw mean -31,338.8 cleaned mean 290.1 missing 32%
percentage_koopwoningen: raw mean -48,826.9 cleaned mean 73.3 missing 49%
Left in, the code makes the average square home to minus 19,332 men, its homes worth minus 31 million euros, and minus 48,827% of them owner-occupied. With the code replaced, the averages are 26 men, a value of 290,000 euros, and 73% owner-occupied, computed over the 51% to 81% of squares where each value is published.
Find every code, see its damage, treat it as missing
1. Find every code
Scan all numeric columns for negative values, which none of these variables can legitimately take, and list the distinct codes:
neg = {c: V[c][V[c] < 0].value_counts() for c in num}
codes = pd.concat(neg.values()).groupby(level=0).sum()
print(f"numeric columns: {len(num)}; columns with negative values: {sum(len(v) > 0 for v in neg.values())}")
print(f"distinct negative values: {codes.to_dict()}")
share = (V[num] == -99997).mean().sort_values()
print(f"share of squares suppressed: from {share.iloc[0]:.0%} ({share.index[0]}) to {share.iloc[-1]:.0%} ({share.index[-1]})")
numeric columns: 128; columns with negative values: 128
distinct negative values: {-99997.0: 8585743}
share of squares suppressed: from 1% (aantal_inwoners) to 99% (aantal_geboorten)
All 128 numeric columns contain negative values, and they are all the same one: -99997, 8,585,743 times. Suppression ranges from 1% of squares for the resident count to 99% for births.
2. What the code does to a sum and a map
A sum adds 99,997 negative people per suppressed square; a colour scale built from the minimum and maximum is stretched by it:
men = V.aantal_mannen
print(f"men, raw sum: {men.sum():,}; cleaned sum: {clean.aantal_mannen.sum():,.0f}")
woz = V.gemiddelde_woz_waarde_woning
print(f"WOZ value range raw: {woz.min():,} to {woz.max():,}; cleaned: {clean.gemiddelde_woz_waarde_woning.min():,.0f} to {clean.gemiddelde_woz_waarde_woning.max():,.0f} thousand euros")
print(f"share of the raw colour range used by real values: {(woz.max() - woz[woz > 0].min()) / (woz.max() - woz.min()):.1%}")
men, raw sum: -7,405,300,942; cleaned sum: 8,076,650
WOZ value range raw: -99,997 to 4,479; cleaned: 3 to 4,479 thousand euros
share of the raw colour range used by real values: 4.3%
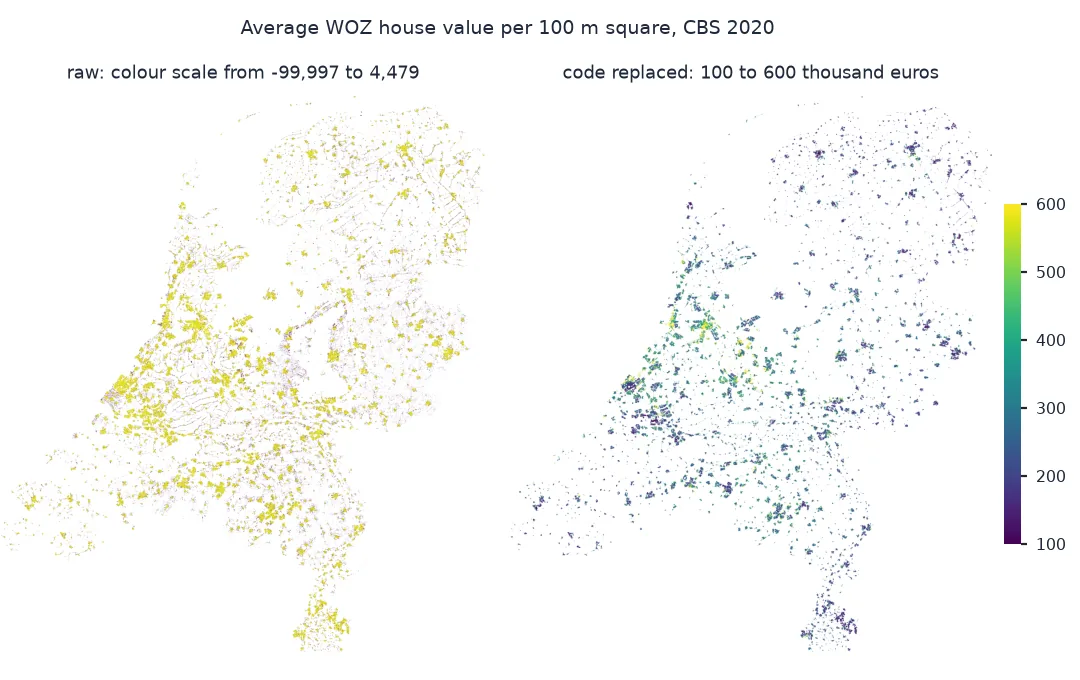
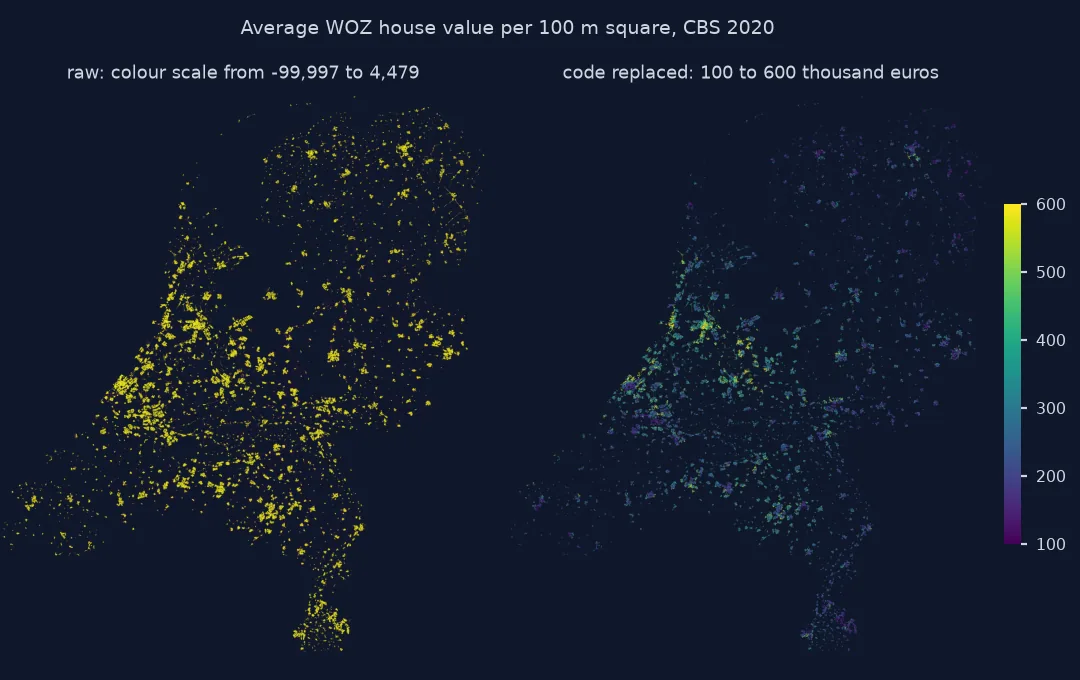
Summed raw, the men come to minus 7.4 billion; cleaned, 8,076,650. The house values run from 3,000 to 4.48 million euros, but a colour scale stretched from -99,997 gives that whole real range 4.3% of its colours, so every square with a value looks the same.
3. Missing, not zero
Filling the code with zero makes sums look plausible but drags every mean down and invents squares with no men or no value:
hh = V.gemiddelde_huishoudensgrootte
for label, s in (("raw", hh), ("filled with 0", hh.where(hh != -99997, 0)), ("missing", clean.gemiddelde_huishoudensgrootte)):
    print(f"mean household size, {label:>13}: {s.mean():>9.2f}")
z = woz.where(woz != -99997, 0)
print(f"squares with a house value of 0 after filling: {(z == 0).sum():,}; with a real value of 0: {(woz == 0).sum():,}")
mean household size, raw: -26914.12
mean household size, filled with 0: 1.68
mean household size, missing: 2.30
squares with a house value of 0 after filling: 120,811; with a real value of 0: 0
Filling with zero turns a mean household size of 2.30 into 1.68, and creates 120,811 squares with homes worth nothing where the file had none.
A weighted mean needs both parts
The data used on this page
The CBS Kaart van 100 meter bij 100 meter met statistieken, final 2020 edition, all columns. gemiddelde_woz_waarde_woning is the average assessed value of dwellings in thousands of euros.
import io
import zipfile
from pathlib import Path

import pandas as pd
import pyogrio
import requests

Path("data").mkdir(exist_ok=True)
GPKG = Path("data/cbs_vk100_2020_vol.gpkg")
if not GPKG.exists():
    url = "https://www.cbs.nl/-/media/cbs/dossiers/nederland-regionaal/vierkanten/100/2023-cbs_vk100_2020_vol.zip"
    zipfile.ZipFile(io.BytesIO(requests.get(url, timeout=900).content)).extract(GPKG.name, "data")
V = pyogrio.read_dataframe(GPKG, read_geometry=False)
print(f"{len(V):,} squares, {V.shape[1]} columns")
383,061 squares, 129 columns
The file has 383,061 squares and 129 columns: the square ID and 128 numeric variables.
Example 1: a weighted mean needs both parts
The average house value of a square should be weighted by its number of dwellings, and both can be suppressed. Use only squares where both are known, and say how many dwellings that covers:
w = clean.aantal_woningen
both = clean.gemiddelde_woz_waarde_woning.notna() & w.notna()
weighted = (clean.gemiddelde_woz_waarde_woning[both] * w[both]).sum() / w[both].sum()
print(f"squares with value and dwellings known: {both.sum():,}, holding {w[both].sum() / w.sum():.0%} of published dwellings")
print(f"mean WOZ value: unweighted over squares {clean.gemiddelde_woz_waarde_woning.mean():,.0f}; weighted by dwellings {weighted:,.0f} thousand euros")
v = clean.gemiddelde_woz_waarde_woning
print(f"median value in squares with 10 or fewer dwellings: {v[both & (w <= 10)].median():,.0f}; with more than 35: {v[both & (w > 35)].median():,.0f}")
squares with value and dwellings known: 262,250, holding 96% of published dwellings
mean WOZ value: unweighted over squares 290; weighted by dwellings 260 thousand euros
median value in squares with 10 or fewer dwellings: 324; with more than 35: 210
Both parts are known for 262,250 squares holding 96% of the published dwellings. Weighted by dwellings, the average value is 260,000 euros, not the 290,000 of the unweighted mean over squares, because squares with few dwellings are the expensive ones, a median of 324,000 euros where there are ten or fewer against 210,000 where there are more than 35, and an unweighted mean counts each of them as much as a dense block.
Why statistical offices use sentinel codes
Statistical offices use sentinel codes because their files must carry a value in every cell of a numeric column and must also say why a value is absent: not applicable, too small to publish, unknown. A missing-value marker such as NaN cannot say why. CBS's grid uses one code, -99997, for "secret", across all 128 numeric columns of the 2020 edition; other editions and other publishers use other codes, and some use several, so the scan in step 1 is worth doing on every new file.
Replacing the code is a decision about what the missing value means, not a cleaning step. A suppressed count is a small positive number, not zero: setting it to zero lowers sums slightly and means a lot, and makes a suppressed square look like an empty one. Treating it as missing keeps sums honest about what they cover, and lets means use only real values, at the cost of a bias toward the squares that survived suppression, which the age group page measures.
Integer columns and percentages
- Integer columns: pandas cannot hold NaN in a NumPy integer column;
whereturns it into float, which is fine for analysis but changes the dtype written back to disk. Use the nullableInt64dtype to keep integers. - Reading with a nodata value: GDAL-based readers do not know the code; rasterising a CBS column needs
nodata=-99997set explicitly, or the code becomes a value in the raster. - Codes in other sources: FARS writes 77.7777 and 99.9999 in coordinates, US census tables use -666666666 for missing estimates; the scan for impossible values finds them all.
- Percentages and averages: these columns are suppressed when their denominator is small, so they are missing exactly where they would be least reliable.
Internal links
- How to use a census population grid in Python — reading the CBS grid
- How to map age groups from a census population grid in Python — what suppression does to shares
- Why Are Some of My Crash Points in the Arctic or the Wrong State? — another set of numeric codes
FAQ
Why does my census grid have negative values?
They are codes for withheld values; in the CBS grid, -99997 means the value is secret. Replace them with missing values before computing anything.
Should I replace -99997 with 0 or NaN?
With NaN, or pandas' missing value: a suppressed count is small but not zero, and zeros drag means down and make suppressed squares look empty.
How do I find all the special codes in a dataset?
Scan every numeric column for values the variable cannot take, such as negative counts, and list the distinct values; codes repeat exactly, real data does not.
Why is the average house value in my CBS data negative?
The suppression code, -99997, was averaged in; a third of the squares have the house value withheld.