
How to Sum a Population Grid by Municipality in Python
On this page
Problem statement
The most common thing done with a population grid is to sum it inside polygons: municipalities, districts, service areas, flood zones. A sum over 1 km cells inside a municipality the size of a few cells depends heavily on how edge cells are treated, and the answer is only as good as the grid, which can be far off for one place while matching the country total.
This page sums GHS-POP 2020 for all 355 Dutch municipalities with fractional cell coverage, compares every sum with the official population on 1 January 2020, finds where the grid is furthest off and why size matters, and repeats the test with WorldPop, whose worst errors turn out to reveal which boundaries it was built on.
Quick answer
exactextract weights each cell by the fraction of it inside the polygon, so no person is counted twice or dropped at a shared boundary:
GM["ghs_pop"] = exact_extract(str(GHS), GM.to_crs(4326), "sum", output="pandas")["sum"].to_numpy()
GM["error"] = GM.ghs_pop / GM.official - 1
print(f"sum over municipalities {GM.ghs_pop.sum():,.0f}; official {GM.official.sum():,}")
print(f"median absolute error {GM.error.abs().median():.1%}; within 5%: {(GM.error.abs() < 0.05).mean():.0%} of {len(GM)} municipalities")
sum over municipalities 17,367,314; official 17,407,585
median absolute error 2.9%; within 5%: 76% of 355 municipalities
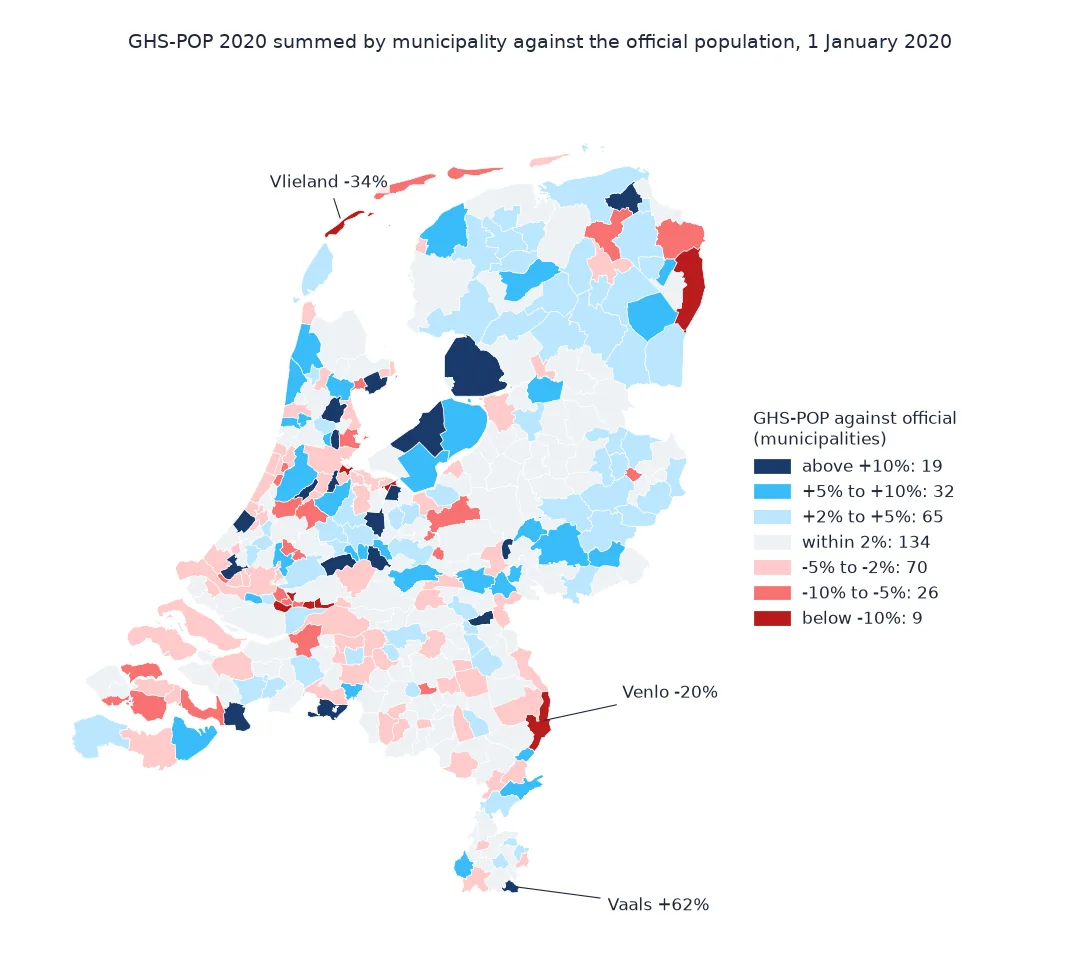
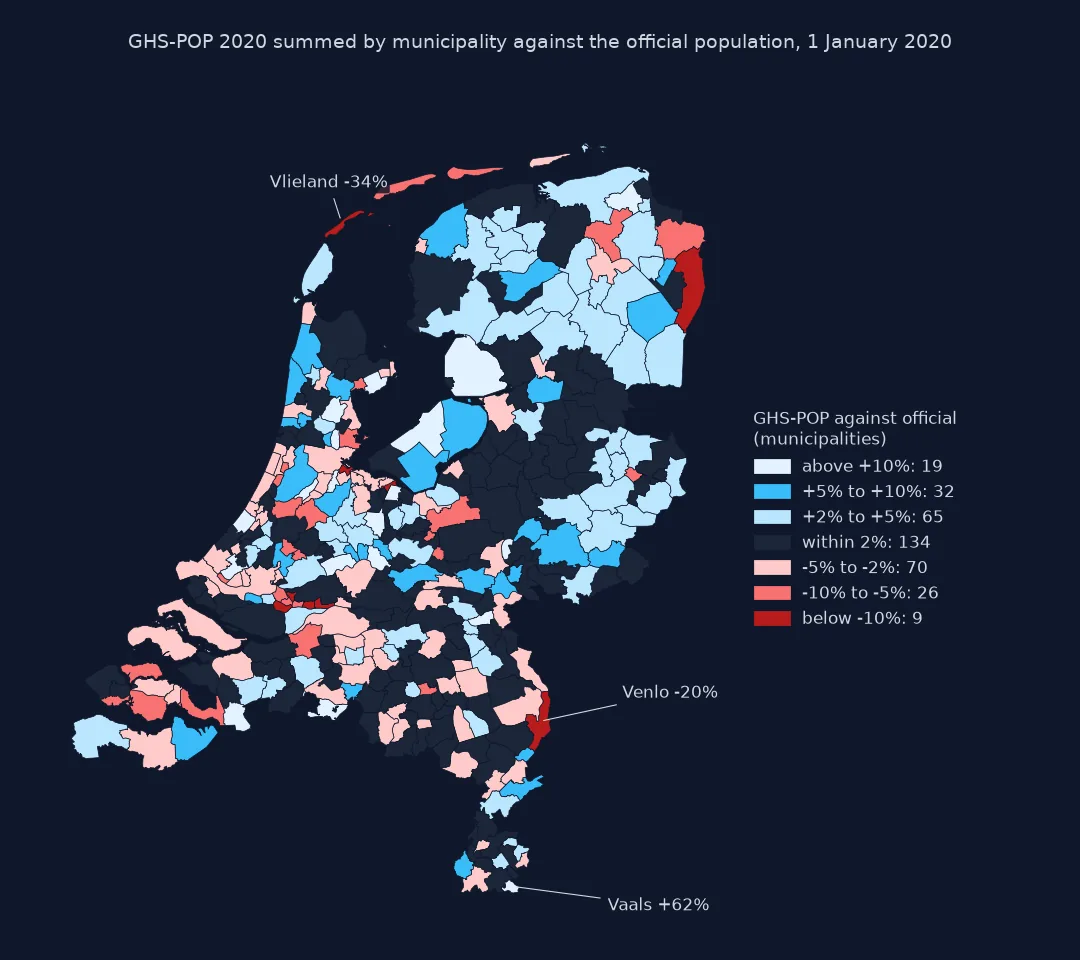
Summed by municipality, GHS-POP comes to 17,367,314, 0.23% below the official total. Half the municipalities are within 2.9% of their official population and three quarters within 5%.
Polygons into the raster's CRS, three counting methods, error by size
1. Polygons into the raster's CRS, and three ways to count
Reproject the polygons, never the population raster. Then compare the three rules for edge cells: cell centre inside, any cell touched, and fractional coverage:
from rasterstats import zonal_stats
g4326 = GM.to_crs(4326)
centre = [z["sum"] or 0 for z in zonal_stats(g4326, str(GHS), stats="sum")]
touched = [z["sum"] or 0 for z in zonal_stats(g4326, str(GHS), stats="sum", all_touched=True)]
for label, v in (("cell centre", centre), ("all touched", touched), ("fractional", GM.ghs_pop)):
    print(f"{label:>12}: {sum(v):>12,.0f}  ({sum(v) / GM.official.sum() - 1:+.2%} against the official total)")
cell centre: 17,389,161 (-0.11% against the official total)
all touched: 20,024,203 (+15.03% against the official total)
fractional: 17,367,314 (-0.23% against the official total)
Counting by cell centre gives 17,389,161, the same as clipping the country. Counting every touched cell gives 20,024,203, 15% too many, because a cell on a shared boundary is counted in both municipalities. Fractional coverage gives 17,367,314: it is 21,847 below the cell-centre sum because coastal and border cells keep only the share of them that lies inside.
2. Where the grid is furthest off
List the largest errors both ways, with each municipality's size:
cols = ["statnaam", "official", "ghs_pop", "error"]
fmt = {"official": "{:,}".format, "ghs_pop": "{:,.0f}".format, "error": "{:+.1%}".format}
print(GM.nlargest(4, "error")[cols].to_string(index=False, formatters=fmt))
print(GM.nsmallest(4, "error")[cols].to_string(index=False, header=False, formatters=fmt))
statnaam official ghs_pop error
Vaals 10,105 16,376 +62.1%
Rozendaal 1,704 2,473 +45.2%
Lopik 14,467 17,146 +18.5%
Beemster 10,022 11,843 +18.2%
Vlieland 1,155 766 -33.7%
Venlo 101,802 81,043 -20.4%
Westerwolde 25,733 21,021 -18.3%
Diemen 30,780 26,230 -14.8%
Vaals, a border town of 10,105 next to Aachen, gets 16,376 people, 62% too many; Rozendaal, with 1,704, gets 45% too many. At the other end Vlieland, a Wadden island of 1,155, gets a third too few, and Venlo, a city of 101,802, a fifth too few. Westerwolde, 18% short, is the municipality whose CBS square with 1,150 residents appears on the census grid page.
3. Error against size
Group the municipalities by population and look at the spread of the error in each group:
GM["size"] = pd.cut(GM.official, [0, 20_000, 50_000, 100_000, 1_000_000], labels=["under 20k", "20-50k", "50-100k", "over 100k"])
print(GM.groupby("size", observed=True).error.agg(municipalities="size", median=lambda e: f"{e.median():+.1%}",
      median_abs=lambda e: f"{e.abs().median():.1%}", worst=lambda e: f"{e.abs().max():.1%}").to_string())
municipalities median median_abs worst
size
under 20k 81 +0.4% 3.7% 62.1%
20-50k 186 +0.3% 2.8% 18.3%
50-100k 56 -0.6% 2.6% 15.0%
over 100k 32 +0.1% 2.5% 20.4%
The typical error shrinks a little with size, from 3.7% in municipalities under 20,000 to 2.5% in those over 100,000, and none of the groups is biased much either way. The extremes are where size matters: the worst error under 20,000 is 62%, against 15% to 20% in the larger groups.
WorldPop and the 2023 municipalities
The data used on this page
GHS-POP R2023A epoch 2020 at 30 arc-seconds (tile R4_C19), the WorldPop R2025A constrained 2020 raster for the Netherlands, the 2020 municipality boundaries from the PDOK CBS gebiedsindelingen web feature service, and each municipality's population on 1 January 2020 from StatLine table 03759ned.
import io
import json
import zipfile
from pathlib import Path

import geopandas as gpd
import pandas as pd
import requests
from exactextract import exact_extract

Path("data").mkdir(exist_ok=True)
name = "GHS_POP_E2020_GLOBE_R2023A_4326_30ss"
GHS = Path("data", f"{name}_V1_0_R4_C19.tif")
if not GHS.exists():
    url = f"https://jeodpp.jrc.ec.europa.eu/ftp/jrc-opendata/GHSL/GHS_POP_GLOBE_R2023A/{name}/V1-0/tiles/{GHS.stem}.zip"
    zipfile.ZipFile(io.BytesIO(requests.get(url, timeout=600).content)).extract(GHS.name, "data")
WP = Path("data/nld_pop_2020_CN_100m_R2025A_v1.tif")
if not WP.exists():
    WP.write_bytes(requests.get("https://data.worldpop.org/GIS/Population/Global_2015_2030/R2025A/2020/NLD/v1/100m/constrained/"
                                "nld_pop_2020_CN_100m_R2025A_v1.tif", timeout=600).content)
B = Path("data/gemeente_2020.geojson")
if not B.exists():
    B.write_bytes(requests.get("https://service.pdok.nl/cbs/gebiedsindelingen/2020/wfs/v1_0", timeout=300, params={
        "service": "WFS", "version": "2.0.0", "request": "GetFeature", "typeName": "gebiedsindelingen:gemeente_gegeneraliseerd",
        "outputFormat": "application/json", "srsName": "EPSG:28992"}).content)
C = Path("data/cbs_pop_2020.json")
if not C.exists():
    C.write_bytes(requests.get("https://opendata.cbs.nl/ODataApi/odata/03759ned/TypedDataSet", timeout=300, params={
        "$filter": "Geslacht eq 'T001038' and Leeftijd eq '10000' and BurgerlijkeStaat eq 'T001019' and Perioden eq '2020JJ00' "
                   "and (substring(RegioS,0,2) eq 'GM' or substring(RegioS,0,2) eq 'NL')",
        "$select": "RegioS,BevolkingOp1Januari_1"}).content)
OFF = {r["RegioS"].strip(): r["BevolkingOp1Januari_1"] for r in json.loads(C.read_text())["value"] if r["BevolkingOp1Januari_1"]}
GM = gpd.read_file(B)
GM["official"] = GM.statcode.map(OFF)
print(f"{len(GM)} municipalities, {GM.official.isna().sum()} without a population; "
      f"smallest {GM.official.min():,} ({GM.loc[GM.official.idxmin(), 'statnaam']}), largest {GM.official.max():,}")
355 municipalities, 0 without a population; smallest 947 (Schiermonnikoog), largest 872,757
All 355 municipalities have a population, from 947 on Schiermonnikoog to 872,757 in Amsterdam.
Example 1: the same test with WorldPop
Sum WorldPop R2025A the same way and compare the errors:
GM["worldpop"] = exact_extract(str(WP), GM.to_crs(4326), "sum", output="pandas")["sum"].to_numpy()
GM["wp_error"] = GM.worldpop / GM.official - 1
for col, label in (("error", "GHS-POP R2023A"), ("wp_error", "WorldPop R2025A")):
    e = GM[col]
    print(f"{label:>15}: median {e.median():+.2%}, median absolute {e.abs().median():.2%}, worst {e.abs().max():.1%}, within 1%: {(e.abs() < 0.01).mean():.0%}")
print(f"Vaals: GHS-POP {GM.set_index('statnaam').error['Vaals']:+.1%}, WorldPop {GM.set_index('statnaam').wp_error['Vaals']:+.1%}")
print(GM.nlargest(3, "wp_error")[["statnaam", "official", "worldpop", "wp_error"]].to_string(index=False, formatters={
      "official": "{:,}".format, "worldpop": "{:,.0f}".format, "wp_error": "{:+.1%}".format}))
GHS-POP R2023A: median +0.18%, median absolute 2.88%, worst 62.1%, within 1%: 19%
WorldPop R2025A: median +1.31%, median absolute 1.39%, worst 109.5%, within 1%: 30%
Vaals: GHS-POP +62.1%, WorldPop -1.6%
statnaam official worldpop wp_error
Beemster 10,022 20,995 +109.5%
Weesp 19,738 33,126 +67.8%
Sint Anthonis 11,664 18,193 +56.0%
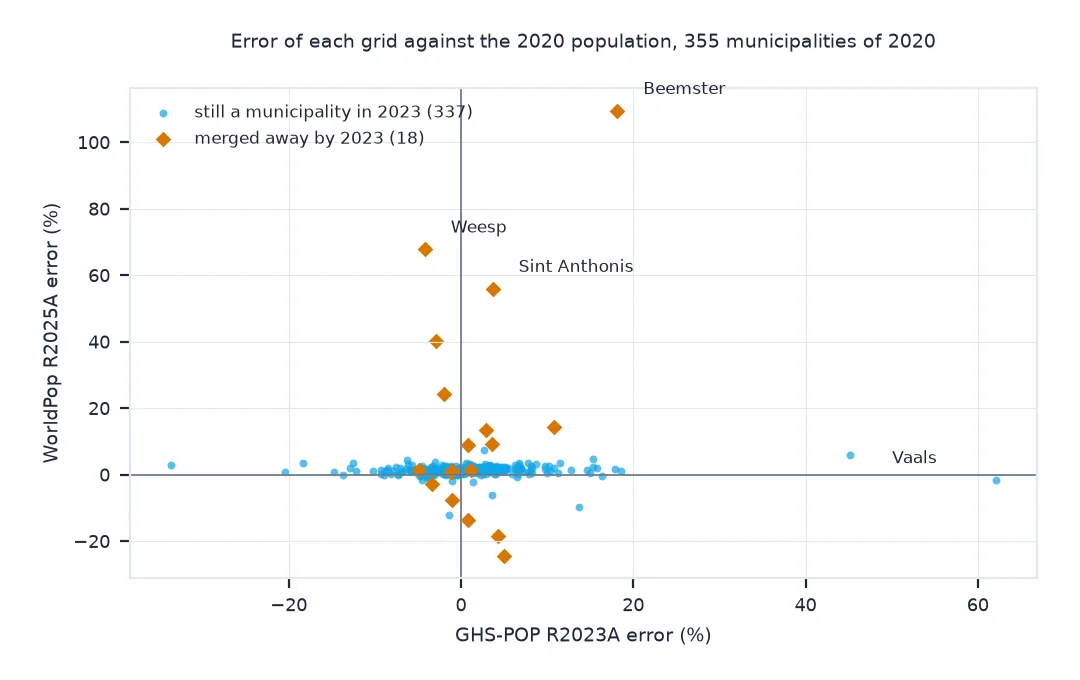
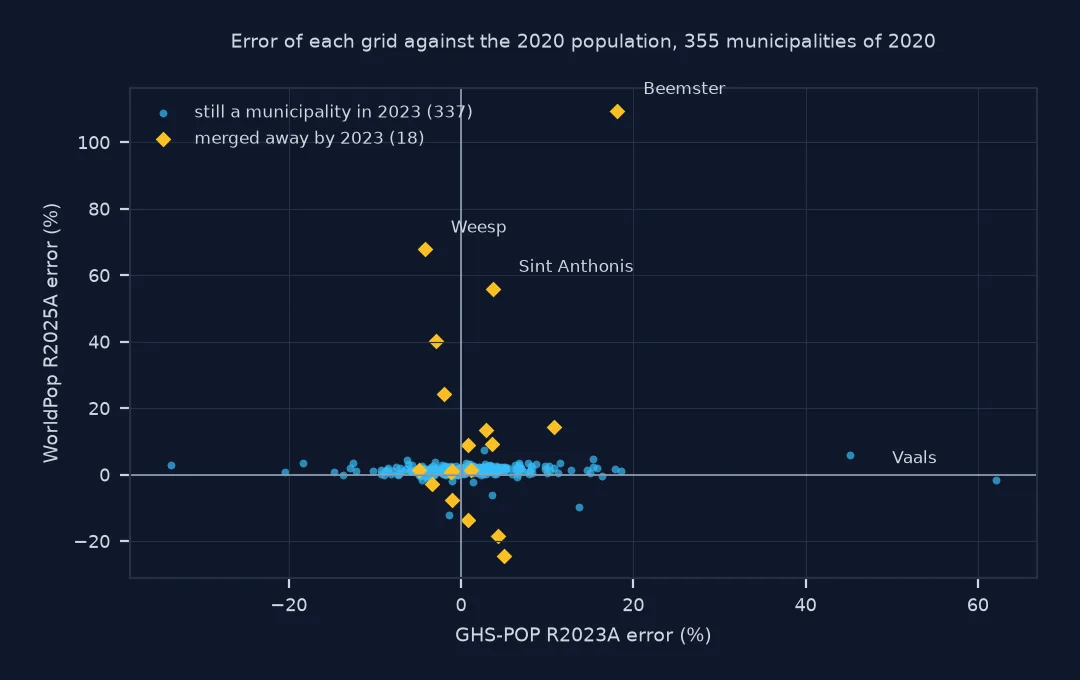
WorldPop's typical error is half GHS-POP's, 1.39% against 2.88%, but it runs 1.31% high in the median, and its worst municipality is off by 109.5%: Beemster gets 20,995 people against 10,022 registered, and Weesp and Sint Anthonis are 68% and 56% high. Vaals, GHS-POP's worst, is 1.6% low in WorldPop.
Example 2: regroup into the municipalities of 2023
All three of WorldPop's worst municipalities were merged into neighbours after 2020. Group the 2020 municipalities into the 2023 ones they became, by where each one's interior point falls, and test again:
G23 = Path("data/gemeente_2023.geojson")
if not G23.exists():
    G23.write_bytes(requests.get("https://service.pdok.nl/cbs/gebiedsindelingen/2023/wfs/v1_0", timeout=300, params={
        "service": "WFS", "version": "2.0.0", "request": "GetFeature", "typeName": "gebiedsindelingen:gemeente_gegeneraliseerd",
        "outputFormat": "application/json", "srsName": "EPSG:28992"}).content)
M23 = gpd.read_file(G23)
gone = set(GM.statnaam) - set(M23.statnaam)
print(f"2023: {len(M23)} municipalities; {len(gone)} of 2020's no longer exist, including {', '.join(sorted(gone & {'Beemster', 'Weesp', 'Sint Anthonis'}))}")
pts = GM.set_geometry(GM.representative_point()).sjoin(M23[["statnaam", "geometry"]].rename(columns={"statnaam": "m2023"}))
R = pts.groupby("m2023")[["official", "ghs_pop", "worldpop"]].sum()
for col, label in (("ghs_pop", "GHS-POP R2023A"), ("worldpop", "WorldPop R2025A")):
    e = R[col] / R.official - 1
    print(f"{label:>15} on 2023 units: median absolute {e.abs().median():.2%}, worst {e.abs().max():.1%} ({e.abs().idxmax()})")
2023: 342 municipalities; 18 of 2020's no longer exist, including Beemster, Sint Anthonis, Weesp
GHS-POP R2023A on 2023 units: median absolute 2.76%, worst 62.1% (Vaals)
WorldPop R2025A on 2023 units: median absolute 1.33%, worst 10.2% (Vught)
Beemster, Weesp and Sint Anthonis are among the 18 municipalities of 2020 that no longer existed in 2023. On the 2023 units GHS-POP barely changes, 2.76% typical and Vaals still 62% high, but WorldPop's worst error drops from 109.5% to 10.2%, in Vught. Its errors were mostly about which boundary it had been built on.
A zonal sum re-aggregates a model
A zonal sum of a population grid is a re-aggregation of a model that was itself built by spreading unit totals over cells. If the polygons are the units the model was scaled to, in the same year, the sum returns the input and says nothing about the model; if they are different units or a different year, the sum measures how well the model placed people. GHS-POP's Dutch inputs are the 2011 register for the municipalities of 2011, carried to 2020 by growth rates, so its 2020 municipal sums test both the growth projection and the placement. WorldPop's R2025A release does not list its inputs on the API, but Example 2 gives them away: its worst municipalities are all ones merged into neighbours after 2020, and on the 2023 units its worst error falls from 109.5% to 10.2%. Its people were distributed within later municipalities, so a 2020 boundary that cuts through one of them splits its people by the model's guess.
Small municipalities show somewhat larger relative errors, and all the extreme ones. A few hundred people misplaced across a boundary are a large share of a small total, and a small municipality covers few cells, so edge cells, where the grid's people may belong to a neighbour, make up more of it. Errors that size are about the grid, not the method: with the same polygons and the same method, Vaals is 62% too high in GHS-POP and within 2% in WorldPop.
Fractional coverage, coasts and boundary years
- Fractional coverage is the default to use: it is the only rule under which the municipal sums add up to the sum over the country;
all_touchedcounts edge cells in two municipalities, as the double counting page shows. - Coastal municipalities: land-only boundaries leave out coastal cells; the grid's people in them are lost to every municipality.
- Boundary year: municipalities merge almost every year in the Netherlands; use the boundaries that match the population figures.
- Large rasters:
exactextractreads only the windows it needs, so a national 100 m raster and 355 polygons take seconds.
Internal links
- Zonal statistics in Python — the general technique
- How to download and clip the GHSL population grid in Python — the grid used here
- How to download and use a WorldPop population raster in Python — the other grid
FAQ
How do I sum a population raster by polygon in Python?
Reproject the polygons to the raster's CRS and run exactextract.exact_extract(raster, polygons, "sum"), which weights edge cells by the share inside each polygon.
Should I use rasterstats or exactextract for population?
exactextract, for population totals: rasterstats counts a cell by its centre or, with all_touched, in every polygon it touches, so municipal totals do not add up.
How accurate is GHSL population for municipalities?
For Dutch municipalities in 2020, half of the GHS-POP sums are within 2.9% of the official population, but a few small municipalities are off by a third or more.
Is WorldPop more accurate than GHSL for municipalities?
Its 2020 sums have a median absolute error of 1.4% for Dutch municipalities, half that of GHS-POP, but run about 1.3% high overall and miss a few municipalities badly; without knowing its inputs, a close match is not proof of how well it places people.