
How to Find Snowmelt Timing from Stations and Satellites in Python
On this page
Problem statement
When the snow melts matters as much as how much there is: it sets when rivers peak, when soils dry out, when plants start growing and when wildfire season can begin. "Snowmelt timing" covers several dates — when melt begins, how fast it goes, when the ground is finally bare — and stations and satellites measure different ones. A snow pillow sees the water leave a single point; a satellite sees the snow surface disappear across a landscape, every pixel at its own elevation and aspect.
This page measures both for water year 2024 in Rocky Mountain National Park, Colorado: melt onset, melt rate and melt-out at seven SNOTEL stations, and the snow-off date of every 500 m MODIS pixel, related to elevation and aspect.
Quick answer
From a station's daily SWE, the peak marks melt onset and the first zero after it marks melt-out; from a daily snow map, the snow-off date is the start of the first sustained snow-free run:
for name, elev, swe in STATIONS:
    peak = swe.idxmax()
    out = swe[peak:][swe[peak:] <= 0].index.min()
    print(f"{name:15} {elev:5.0f} m  peak {swe.max():4.0f} mm on {peak:%d %b}, melt-out {out:%d %b}, "
          f"{(out - peak).days:2d} days at {swe.max() / (out - peak).days:4.1f} mm/day")
Copeland Lake 2612 m peak 170 mm on 14 Mar, melt-out 13 Apr, 30 days at 5.7 mm/day
Phantom Valley 2752 m peak 244 mm on 29 Mar, melt-out 21 May, 53 days at 4.6 mm/day
Wild Basin 2868 m peak 554 mm on 10 May, melt-out 04 Jun, 25 days at 22.1 mm/day
Bear Lake 2893 m peak 554 mm on 09 May, melt-out 05 Jun, 27 days at 20.5 mm/day
Sawtooth 2938 m peak 732 mm on 09 May, melt-out 17 Jun, 39 days at 18.8 mm/day
Lake Irene 3255 m peak 607 mm on 09 May, melt-out 10 Jun, 32 days at 19.0 mm/day
Willow Park 3264 m peak 559 mm on 10 May, melt-out 10 Jun, 31 days at 18.0 mm/day
Define the dates, read stations, add MODIS snow-off
1. Define the dates
Melt onset is when the pack stops gaining and starts losing — at a station, the date of peak SWE. Melt-out is when the last snow is gone — the first day after the peak with zero SWE. Between them, peak SWE divided by the days between gives a mean melt rate.
2. Read them from the stations
The quick answer shows two regimes. The two lowest stations, Copeland Lake and Phantom Valley, peaked in March with small packs and melted slowly through spring. The five above 2,850 m all peaked within two days of each other, on 9–10 May, and then lost 18–22 mm of water a day for about a month:
high = [(n, swe) for n, e, swe in STATIONS if e > 2850]
peaks = sorted({swe.idxmax().strftime("%d %b") for _, swe in high})
print(len(high), "stations above 2,850 m; peak dates:", peaks)
5 stations above 2,850 m; peak dates: ['09 May', '10 May']
A shared peak date across stations 40 km apart is the signature of weather, not elevation: a warm spell in early May switched the whole high snowpack from accumulation to melt at once.
3. Snow-off from MODIS
From the gap-filled MOD10A1 series, each pixel's snow-off date is the first day after 1 February that begins a run of at least 14 snow-free days:
print(f"{(~np.isnan(snowoff) & INBOX).sum():,} pixels with a snow-off date, "
      f"{(np.isnan(snowoff) & INBOX).sum()} without (no 14-day snow-free run before 30 September)")
6,937 pixels with a snow-off date, 90 without (no 14-day snow-free run before 30 September)
The 14-day rule keeps a few bare days in a spring thaw from counting as the end of the season.
4. Relate it to elevation and aspect
for lo in range(2400, 3800, 200):
    k = OK & (DEM >= lo) & (DEM < lo + 200)
    print(f"{lo}-{lo + 200} m: median snow-off day {np.median(snowoff[k]):.0f} ({k.sum()} pixels)")
b = np.polyfit(DEM[OK], snowoff[OK], 1)[0] * 100
print(f"overall: {b:.1f} days later per 100 m")
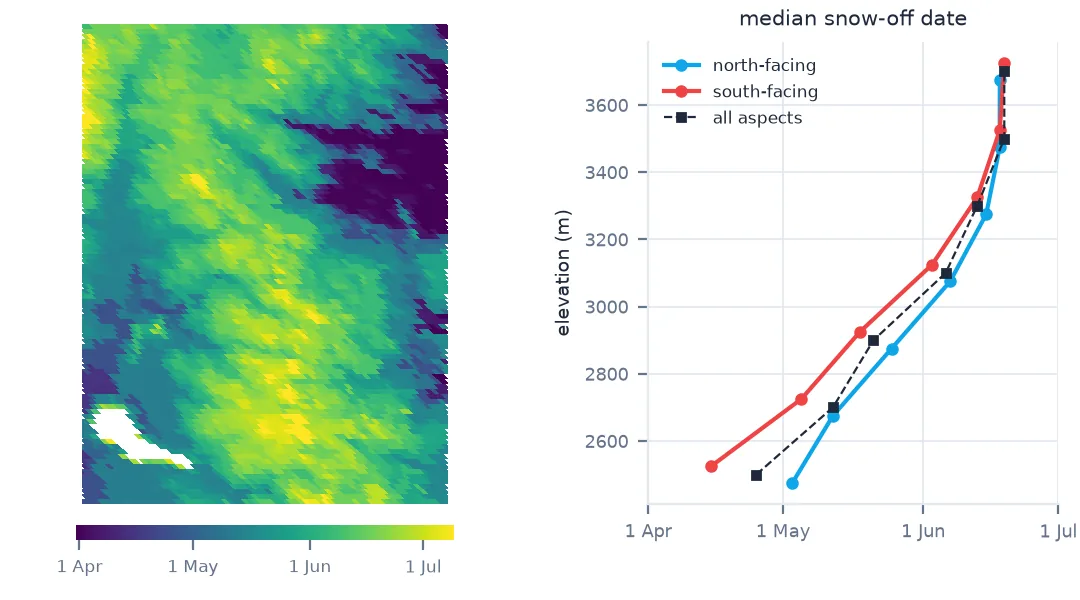
2400-2600 m: median snow-off day 115 (722 pixels)
2600-2800 m: median snow-off day 132 (1106 pixels)
2800-3000 m: median snow-off day 141 (1041 pixels)
3000-3200 m: median snow-off day 157 (1090 pixels)
3200-3400 m: median snow-off day 164 (1242 pixels)
3400-3600 m: median snow-off day 170 (1061 pixels)
3600-3800 m: median snow-off day 170 (468 pixels)
overall: 5.9 days later per 100 m
About six days later for every 100 m of elevation, levelling off above 3,400 m where the snow lasted into mid-June almost everywhere. Aspect adds a smaller effect — south-facing slopes lose their snow a few days earlier than north-facing ones at the same elevation.
5. Compare the two views
At the stations, MODIS snow-off and SNOTEL melt-out agree within a few days on open ground and differ by up to three weeks under forest, where the satellite sees the canopy rather than the snow beneath it (see the MODIS time series). The station gives a precise date at a point; the satellite gives the pattern across the park.
Aspect and melt-out at each station
The data used on this page
NRCS SNOTEL daily SWE for seven stations in Rocky Mountain National Park, water year 2024, from the AWDB REST API; MOD10A1.061 snow cover (Hall and Riggs, NASA NSIDC DAAC) via Microsoft Planetary Computer; Copernicus DEM GLO-30 (© DLR e.V. 2010–2014 and © Airbus Defence and Space GmbH 2014–2018, provided under COPERNICUS by the European Union and ESA).
import numpy as np
import pandas as pd
import planetary_computer
import pystac_client
import rasterio
import requests
from pyproj import Transformer
from rasterio.warp import Resampling, reproject, transform_bounds
from rasterio.windows import from_bounds

AWDB = "https://wcc.sc.egov.usda.gov/awdbRestApi/services/v1"
TRIPLETS = ["322:CO:SNTL", "1042:CO:SNTL", "412:CO:SNTL", "565:CO:SNTL", "688:CO:SNTL", "1251:CO:SNTL", "870:CO:SNTL"]
meta = requests.get(f"{AWDB}/stations?stationTriplets={','.join(TRIPLETS)}", timeout=60).json()
STATIONS = []
for m in sorted(meta, key=lambda m: m["elevation"]):
    v = requests.get(f"{AWDB}/data?stationTriplets={m['stationTriplet']}&elements=WTEQ&duration=DAILY"
                     "&beginDate=2023-10-01&endDate=2024-09-30", timeout=60).json()[0]["data"][0]["values"]
    STATIONS.append((m["name"], m["elevation"] * 0.3048,
                     pd.Series([x["value"] * 25.4 for x in v], index=pd.to_datetime([x["date"] for x in v]))))

BOX = (-105.9, 40.1, -105.5, 40.5)
catalog = pystac_client.Client.open("https://planetarycomputer.microsoft.com/api/stac/v1",
                                    modifier=planetary_computer.sign_inplace)
items = sorted([i for i in catalog.search(collections=["modis-10A1-061"], bbox=BOX, datetime="2023-10-01/2024-09-30").items()
                if i.id.startswith("MOD10A1") and ".h09v04." in i.id], key=lambda i: i.id)
by_date = {}
for it in items:
    with rasterio.open(planetary_computer.sign(it).assets["NDSI_Snow_Cover"].href) as src:
        w = from_bounds(*transform_bounds("EPSG:4326", src.crs, *BOX), src.transform).round_offsets().round_lengths()
        by_date[it.properties["start_datetime"][:10]] = src.read(1, window=w)
        TR, CRS_ = src.window_transform(w), src.crs
dates = pd.to_datetime(sorted(by_date))
stack = np.array([by_date[d.strftime("%Y-%m-%d")] for d in dates])
state = np.where(stack <= 100, (stack >= 10).astype(float), np.nan)
filled = pd.DataFrame(state.reshape(len(dates), -1), index=dates).ffill(limit=5).to_numpy().reshape(state.shape)

# snow-off: first day after 1 February starting a run of at least 14 snow-free days
after = np.asarray(dates >= "2024-02-01")
bare = filled[after] == 0
cs = np.cumsum(np.r_[np.zeros((1,) + bare.shape[1:]), bare], axis=0)
run14 = (cs[14:] - cs[:-14]) >= 14
first = np.where(run14.any(0), run14.argmax(0), -1)
snowoff = np.where(first >= 0, np.asarray(dates[after].dayofyear)[np.clip(first, 0, None)], np.nan).astype(float)

DEM = np.zeros(snowoff.shape, np.float32)
with rasterio.open("https://copernicus-dem-30m.s3.amazonaws.com/Copernicus_DSM_COG_10_N40_00_W106_00_DEM/"
                   "Copernicus_DSM_COG_10_N40_00_W106_00_DEM.tif") as src:
    reproject(src.read(1), DEM, src_transform=src.transform, src_crs=src.crs, dst_transform=TR, dst_crs=CRS_,
              resampling=Resampling.average)
rr, cc = np.mgrid[0:DEM.shape[0], 0:DEM.shape[1]]
lon, lat = Transformer.from_crs(CRS_, 4326, always_xy=True).transform(*(TR * (cc + 0.5, rr + 0.5)))
INBOX = (lon >= BOX[0]) & (lon <= BOX[2]) & (lat >= BOX[1]) & (lat <= BOX[3]) & (DEM > 0)
OK = INBOX & ~np.isnan(snowoff)
print(len(STATIONS), "stations;", len(dates), "MODIS days;", OK.sum(), "pixels with a snow-off date")
7 stations; 366 MODIS days; 6937 pixels with a snow-off date
Example 1: aspect at the same elevation
gy, gx = np.gradient(DEM, 463)
aspect = (np.degrees(np.arctan2(-gx, gy)) + 360) % 360
mid = OK & (DEM >= 2800) & (DEM < 3200)
for name, sel in (("north-facing", (aspect >= 315) | (aspect < 45)), ("south-facing", (aspect >= 135) & (aspect < 225))):
    print(f"{name}, 2,800-3,200 m: median snow-off day {np.median(snowoff[mid & sel]):.0f} ({(mid & sel).sum()} pixels)")
north-facing, 2,800-3,200 m: median snow-off day 152 (517 pixels)
south-facing, 2,800-3,200 m: median snow-off day 148 (784 pixels)
Example 2: melt-out at each station's pixel
to_sin = Transformer.from_crs(4326, CRS_, always_xy=True)
for m, (name, elev, swe) in zip(sorted(meta, key=lambda m: m["elevation"]), STATIONS):
    col, row = ~TR * to_sin.transform(m["longitude"], m["latitude"])
    sat = snowoff[int(row), int(col)]
    out = swe[swe.idxmax():][swe[swe.idxmax():] <= 0].index.min()
    print(f"{name:15} SNOTEL melt-out day {out.dayofyear}, MODIS snow-off day {sat:.0f}")
Copeland Lake SNOTEL melt-out day 104, MODIS snow-off day 135
Phantom Valley SNOTEL melt-out day 142, MODIS snow-off day 149
Wild Basin SNOTEL melt-out day 156, MODIS snow-off day 145
Bear Lake SNOTEL melt-out day 157, MODIS snow-off day 151
Sawtooth SNOTEL melt-out day 169, MODIS snow-off day 164
Lake Irene SNOTEL melt-out day 162, MODIS snow-off day 159
Willow Park SNOTEL melt-out day 162, MODIS snow-off day 169
Snow-off with a 14-day rule and melt-out from a pillow are different definitions at different scales, and they disagree in both directions. At Copeland Lake, the lowest station, MODIS snow-off comes a month after the pillow emptied: late-April snowfalls covered the ground again for a few days at a time, and the 14-day rule waits until they stop. At the forested Wild Basin station MODIS is eleven days early, seeing the canopy rather than the snow below. Each date is right for its own definition.
What drives snowmelt
Snowmelt is driven by energy — sunshine, warm air, rain — and the energy available depends on the date, the elevation and the slope's orientation. Elevation sets the temperature, so melt-out marches uphill through spring at a rate of days per hundred metres. Aspect sets the sunshine, so south-facing slopes melt first. Weather overrides both: a warm spell can start melt across a whole range on the same day, as early May 2024 did at every high station here.
Stations and satellites complement each other. A snow pillow records the water leaving the pack every day, giving the onset, rate and end of melt at one point; a daily satellite snow map shows the pattern of snow-off across a landscape, every pixel at its own elevation and aspect, but cannot see water and is blinded by cloud and canopy. Used together — stations for timing and rate, satellite maps for the spatial pattern — they describe when and where the snow left in a way neither can alone.
Run lengths, shared peaks and forest delays
- Define the dates: peak (onset), first zero after peak (melt-out), sustained snow-free run (snow-off).
- A minimum run length keeps spring thaws from ending the season early; 14 days here.
- Shared peak dates across stations indicate a weather-driven melt onset.
- Gap-fill MODIS before computing snow-off, and cap the fill.
- Forest delays the true melt-out relative to what the satellite sees.
- Low stations can have several melt episodes; the last one is the melt-out.
Internal links
- How to analyse SNOTEL snow water equivalent — 45 years of melt-out at Niwot
- How to make a MODIS snow cover time series — the daily maps used here
- How to find the snow line elevation — the same retreat from Sentinel-2
- Snow water equivalent explained — what the pillows measure
- How to compute glacier hypsometry — elevation and ice
FAQ
How do I find the snowmelt date from SNOTEL data?
Take the date of peak SWE as melt onset and the first day after it with zero SWE as melt-out; peak SWE divided by the days between is the mean melt rate.
How do I compute snow-off dates from MODIS?
Gap-fill the daily snow cover, then for each pixel find the first date after late winter that begins a sustained snow-free run, for example 14 days.
How does elevation affect snowmelt timing?
In Rocky Mountain National Park in 2024, MODIS snow-off came about six days later for every 100 m of elevation, levelling off above 3,400 m.
How fast does a mountain snowpack melt?
At the five SNOTEL stations above 2,850 m in the park in 2024, peak SWE of 550–730 mm melted at 18–22 mm of water a day.