
How to Map Sea Surface Temperature Anomalies in Python
On this page
Problem statement
A map of sea surface temperature mostly shows latitude: warm tropics, cold poles. What makes a month newsworthy is where the water was warmer or colder than usual, which needs an anomaly map: each cell's temperature minus that cell's normal for the same time of year. Making one takes a climatology per cell from a 30-year base period, the same period's data for the month of interest, a diverging colour scale centred on zero, and care with averaging over a region whose cells are not equal in area.
This page builds a June 1991–2020 climatology for every 1° cell of the North Atlantic from daily OISST, maps the June 2023 anomaly, measures how much of the ocean was unusually warm, and ranks June 2023 among all Junes since 1982.
Quick answer
Average each June to one field, average the baseline Junes per cell, and subtract:
june = {y: monthly(y) for y in range(1982, 2024)}
clim = xr.concat([june[y] for y in range(1991, 2021)], "year").mean("year")
anom = june[2023] - clim
w = np.cos(np.deg2rad(anom.latitude))
print(f"June 2023, North Atlantic {LAT[0]}-{LAT[1]} N: area-weighted mean anomaly {float(anom.weighted(w).mean()):+.2f} °C against June 1991-2020")
print(f"cells: {int(anom.notnull().sum()):,}; warmest anomaly {float(anom.max()):+.2f} °C; coldest {float(anom.min()):+.2f} °C")
June 2023, North Atlantic 0.125-69.875 N: area-weighted mean anomaly +0.89 °C against June 1991-2020
cells: 4,244; warmest anomaly +3.60 °C; coldest -5.13 °C
Averaged over the 4,244 ocean cells of the region, with area weights, June 2023 was 0.89 °C warmer than the June normal for 1991–2020. Individual cells range from 3.60 °C above to 5.13 °C below normal.
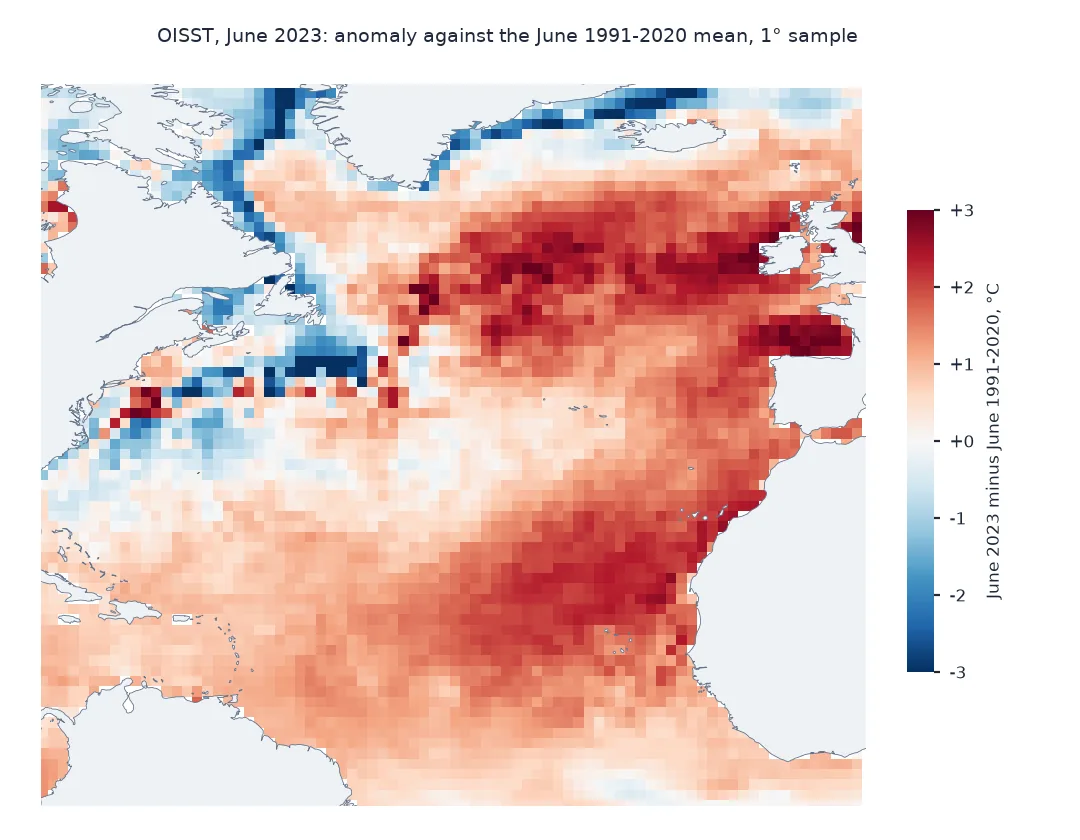
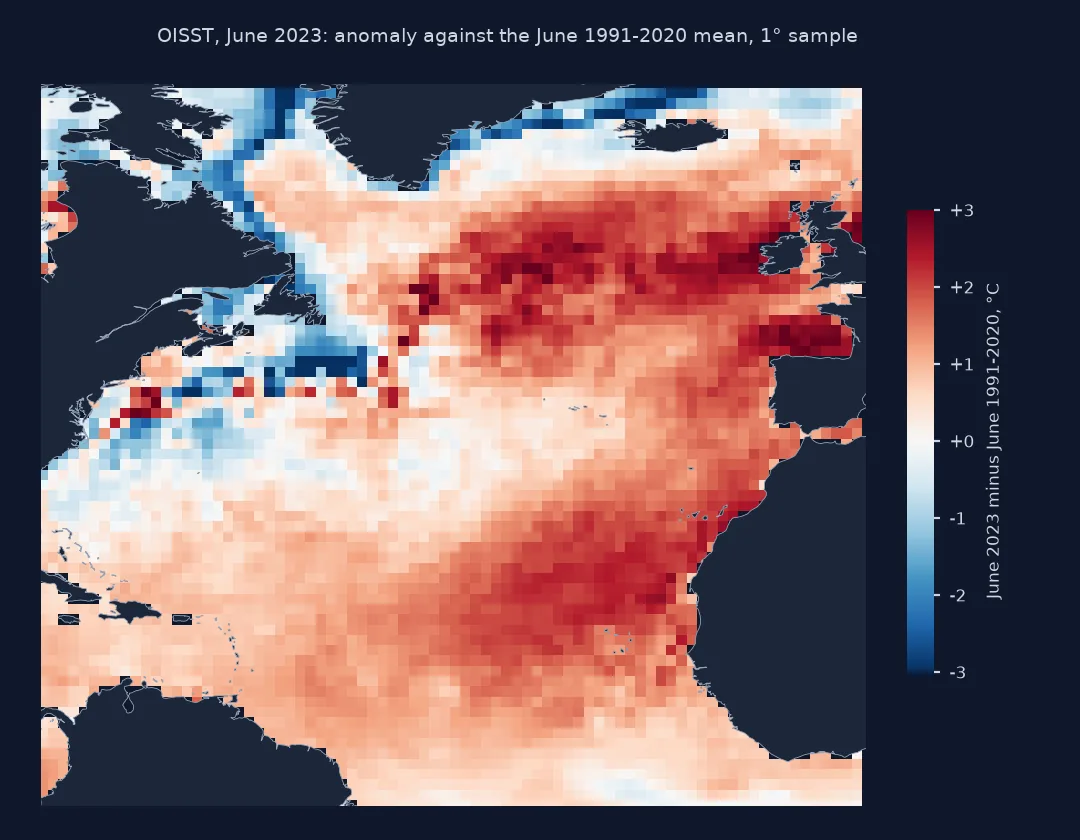
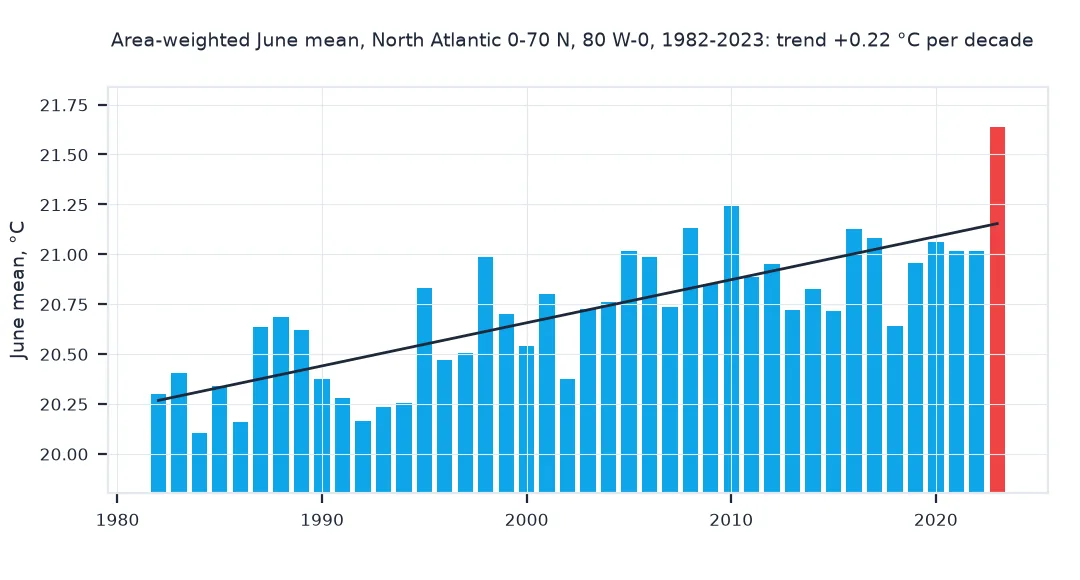
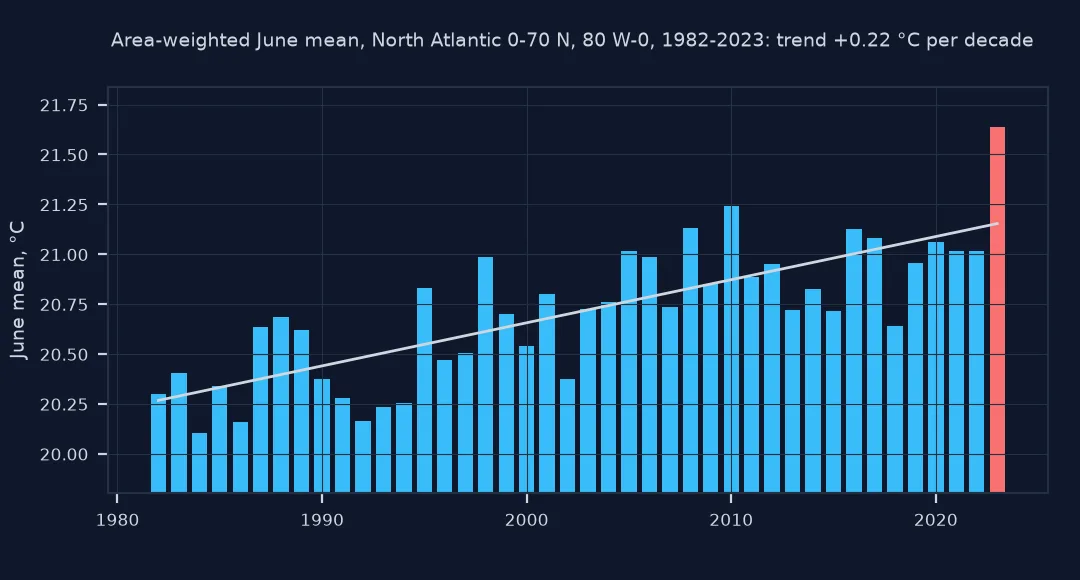
A month per year at one degree, unusual warmth, June 2023 in context
1. A month of days per year, at 1°
OISST is daily at 0.25°. For a basin-wide map, request every fourth cell, which gives a 1° grid, and average the days of each June:
d = xr.open_dataset(path_for(2023)).sst
print(f"June 2023 request: {d.sizes['time']} days, {d.sizes['latitude']} x {d.sizes['longitude']} cells, "
      f"spacing {float(d.latitude[1] - d.latitude[0]):.2f}°; file {path_for(2023).stat().st_size / 1e6:.1f} MB")
print(f"years downloaded: {len(june)}; total {sum(path_for(y).stat().st_size for y in june) / 1e6:.0f} MB")
June 2023 request: 30 days, 70 x 80 cells, spacing 1.00°; file 0.7 MB
years downloaded: 42; total 29 MB
Each June is 30 daily fields of 70 by 80 cells at 1° spacing, 0.7 MB; all 42 Junes together are 29 MB.
2. How much of the ocean was unusually warm
Area matters more than cell counts: at 60°N a 1° cell is half the size of one at the equator. Weight by the cosine of latitude:
valid = anom.notnull()
for thr in (1, 2, 3):
    share = float((w * (anom > thr)).sum() / (w * valid).sum())
    print(f"area more than {thr} °C above the June normal: {share:.1%}")
print(f"area below normal: {float((w * (anom < 0)).sum() / (w * valid).sum()):.1%}")
area more than 1 °C above the June normal: 46.1%
area more than 2 °C above the June normal: 11.7%
area more than 3 °C above the June normal: 0.3%
area below normal: 13.2%
Nearly half the region's ocean area, 46.1%, was more than 1 °C above its June normal and 11.7% more than 2 °C; only 13.2% was below normal.
3. June 2023 among all Junes
Rank the area-weighted mean temperature of every June since 1982 for the same region:
series = pd.Series({y: float(june[y].weighted(w).mean()) for y in june})
rank = series.rank(ascending=False).astype(int)
print(f"June 2023: {series[2023]:.2f} °C, rank {rank[2023]} of {len(series)}; previous warmest June: {series.drop(2023).idxmax()} at {series.drop(2023).max():.2f} °C")
print(f"1991-2020 June mean {series.loc[1991:2020].mean():.2f} °C; trend 1982-2023 {np.polyfit(series.index, series.values, 1)[0] * 10:+.2f} °C per decade")
June 2023: 21.64 °C, rank 1 of 42; previous warmest June: 2010 at 21.24 °C
1991-2020 June mean 20.75 °C; trend 1982-2023 +0.22 °C per decade
June 2023, at 21.64 °C, is the warmest June in the 42-year record, 0.40 °C above the previous record set in 2010 and 0.89 °C above the 1991–2020 June mean of 20.75 °C. Across all 42 Junes the region warmed by 0.22 °C per decade.
Where it was warmest relative to normal
The data used on this page
Daily NOAA OISST for every June from 1982 to 2023, 0° to 70°N and 80°W to 0° at every fourth 0.25° cell, with a 1991–2020 baseline. Each year comes from NOAA CoastWatch's ERDDAP with any day it lacks filled from NCEI's daily files, as in the marine heatwave guide, and the setup checks that every June has 30 days.
import io
import time
from pathlib import Path

import numpy as np
import pandas as pd
import requests
import xarray as xr

Path("data").mkdir(exist_ok=True)
CW = "https://coastwatch.pfeg.noaa.gov/erddap/griddap"
ARCHIVE = "https://www.ncei.noaa.gov/data/sea-surface-temperature-optimum-interpolation/v2.1/access/avhrr"
def _get(url):
    for attempt in range(5):                                            # a busy ERDDAP answers 500 or 503
        r = requests.get(url, timeout=900)
        if r.status_code < 500:
            break
        time.sleep(30 * (attempt + 1))
    r.raise_for_status()
    return r
def _lon180(da):
    return da.assign_coords(longitude=(da.longitude + 180) % 360 - 180).sortby("longitude")
def oisst(start, end, path, var="sst", lat=(52, 54), lon=(-12, -10), step=1):
    """Daily OISST v2.1 for a box and dates, saved to path, longitudes -180 to 180. CoastWatch's ERDDAP
    aggregation (version 2 before 2016, the same analysis as v2.1 for those years), with every day it
    lacks taken from NCEI's daily archive: the aggregations skip days, and a skipped day is silent."""
    path = Path(path)
    if not path.exists():
        days = pd.date_range(start, end)
        ds = "ncdcOisst2Agg" if days[-1].year <= 2015 else "ncdcOisst21Agg"
        a, b = lon[0] % 360, lon[1] % 360
        got = []
        for lo in [(a, b)] if a <= b else [(a, 359.875), (0.125, b)]:          # across 0°, two requests
            q = (f"{var}[({start}T12:00:00Z):1:({end}T12:00:00Z)][(0.0)]"
                 f"[({lat[0]}):{step}:({lat[1]})][({lo[0]}):{step}:({lo[1]})]")
            got.append(xr.open_dataset(io.BytesIO(_get(f"{CW}/{ds}.nc?{q}").content))[var].load())
        da = _lon180(xr.concat(got, "longitude").squeeze("zlev", drop=True))
        da = da.sel(time=slice(start, f"{end}T23:59"))                       # a missing end day snaps past it
        for day in days.difference(pd.DatetimeIndex(da.time.values).normalize()):
            url = f"{ARCHIVE}/{day:%Y%m}/oisst-avhrr-v02r01.{day:%Y%m%d}.nc"
            d = xr.open_dataset(io.BytesIO(_get(url).content))[var].squeeze("zlev", drop=True)
            d = _lon180(d.rename(lat="latitude", lon="longitude"))
            d = d.sel(latitude=da.latitude, longitude=da.longitude, method="nearest")
            da = xr.concat([da, d.assign_coords(latitude=da.latitude, longitude=da.longitude).load()], "time")
        da.sortby("time").to_dataset(name=var).to_netcdf(path)
    return xr.open_dataset(path)[var]
LAT, LON = (0.125, 69.875), (-79.875, -0.125)
def path_for(year):
    return Path(f"data/oisst_natl_june_{year}_1deg_v2.nc")
def monthly(year):
    da = oisst(f"{year}-06-01", f"{year}-06-30", path_for(year), "sst", LAT, LON, step=4)
    assert da.sizes["time"] == 30, f"June {year}: {da.sizes['time']} days"
    return da.mean("time")
print(f"region {LAT[0]} to {LAT[1]} N, {LON[0]} to {LON[1]} E, every 4th cell")
region 0.125 to 69.875 N, -79.875 to -0.125 E, every 4th cell
The region runs from the equator to 70°N and from 80°W to 0°, sampled at every fourth cell.
Example 1: where it was warmest relative to normal
Find the cells with the largest anomalies and the sub-regions that stood out:
boxes = {"west of Ireland": ((50, 56), (-20, -10)), "Bay of Biscay": ((43, 48), (-10, -1)), "tropical Atlantic": ((5, 20), (-60, -20)),
         "Caribbean Sea": ((12, 20), (-79, -62))}
for name, ((a, b), (c, e)) in boxes.items():
    sub = anom.sel(latitude=slice(a, b), longitude=slice(c, e))
    print(f"{name:>18}: mean anomaly {float(sub.weighted(np.cos(np.deg2rad(sub.latitude))).mean()):+.2f} °C over {int(sub.notnull().sum())} cells")
west of Ireland: mean anomaly +2.42 °C over 60 cells
Bay of Biscay: mean anomaly +2.61 °C over 36 cells
tropical Atlantic: mean anomaly +1.33 °C over 586 cells
Caribbean Sea: mean anomaly +0.78 °C over 128 cells
The largest departures were close to Europe: 2.42 °C above normal west of Ireland and 2.61 °C in the Bay of Biscay. The tropical Atlantic, where hurricanes form, was 1.33 °C above normal over a much larger area, and the Caribbean 0.78 °C.
A scale that reads as departure
The colour scale is diverging and centred on zero, so warm and cold read as opposites, and symmetric, so a degree above normal and a degree below look equally strong. A sequential scale would turn the anomaly map back into a temperature map, with the Caribbean bright and the sea west of Ireland dark, whatever either was doing in June 2023.
Daily or monthly climatology and sea ice
- Daily or monthly climatology: a monthly mean of daily anomalies equals the monthly mean temperature minus the monthly mean climatology; computing it monthly, as here, needs much less data.
- Stride: every fourth cell is a 1° sample, not a 1° average; for a smooth 1° field, average the 0.25° cells instead, at sixteen times the download.
- Sea ice: OISST fills ice-covered cells with a freezing-point temperature, near -1.8 °C, so anomalies near the ice edge mean less than in open water.
- Baselines differ between sources: OISST's own
anomis relative to 1971–2000; see the baseline fix.
Internal links
- How to download NOAA OISST sea surface temperature in Python — the data
- Fixing sea surface temperature anomalies that disagree between sources — base periods
- How to map marine heatwave days in Python — anomalies turned into events
FAQ
How do I make an SST anomaly map in Python?
Compute each cell's climatology for the same time of year over a 30-year base period, subtract it from the field of interest, and plot with a diverging colour map centred on zero.
Why weight by the cosine of latitude?
On a latitude-longitude grid, cells shrink towards the poles in proportion to the cosine of latitude, so unweighted means give high latitudes too much influence.
Was June 2023 the warmest June in the North Atlantic?
For 0–70°N and 80°W–0° in OISST, yes: June 2023 was the warmest of the 42 Junes since 1982, at 21.64 °C, 0.40 °C above the previous warmest, June 2010.
Should I use 1971-2000 or 1991-2020 as the baseline?
1991–2020 is the current WMO standard for describing present conditions; older baselines give larger anomalies.