
How to Compare Radar and Gauge Rainfall in Python
On this page
Problem statement
Ninety CoCoRaHS gauges under Hurricane Beryl's landfall in Texas, compared with NOAA's MRMS 24-hour rainfall ending at 00 UTC, correlate at −0.15, and the radar comes out 61.6 mm wetter on average. Compared with the MRMS total ending at 12 UTC — about 7 a.m. local, when CoCoRaHS volunteers read their gauges — the same gauges correlate at +0.77. A gauge's "daily total" ends whenever its network's observers read it, airport stations at midnight, cooperative observers often in the morning, and the comparison only means something once each network's day is matched to the radar window that covers it.
This page compares NOAA's MRMS multi-sensor rainfall for Hurricane Beryl's landfall in Texas (8 July 2024) with about 120 GHCN-Daily gauges from three networks, and shows how the agreement depends on matching the windows.
Quick answer
Find each gauge network's observation time, pick the MRMS 24-hour product whose window ends at that time, sample the grid at each gauge, and compare:
def compare(gauges, stamp):
    q = mrms_24h(stamp)
    at = q.sel(latitude=xr.DataArray(gauges.LATITUDE.values, dims="p"),
               longitude=xr.DataArray(gauges.LONGITUDE.values % 360, dims="p"), method="nearest").values
    ok = np.isfinite(at)
    g, r = gauges.PRCP.values[ok], at[ok]
    return ok.sum(), np.corrcoef(g, r)[0, 1], np.mean(r - g)

coco = G[(G.network == "CoCoRaHS") & (G.DATE == "2024-07-09")]
for stamp in ("20240709-000000", "20240709-120000"):
    n, r, bias = compare(coco, stamp)
    print(f"CoCoRaHS day dated 9 July vs MRMS 24 h ending {stamp[9:11]} UTC: n={n}, r={r:+.2f}, bias {bias:+.1f} mm")
CoCoRaHS day dated 9 July vs MRMS 24 h ending 00 UTC: n=90, r=-0.15, bias +61.6 mm
CoCoRaHS day dated 9 July vs MRMS 24 h ending 12 UTC: n=90, r=+0.77, bias -8.9 mm
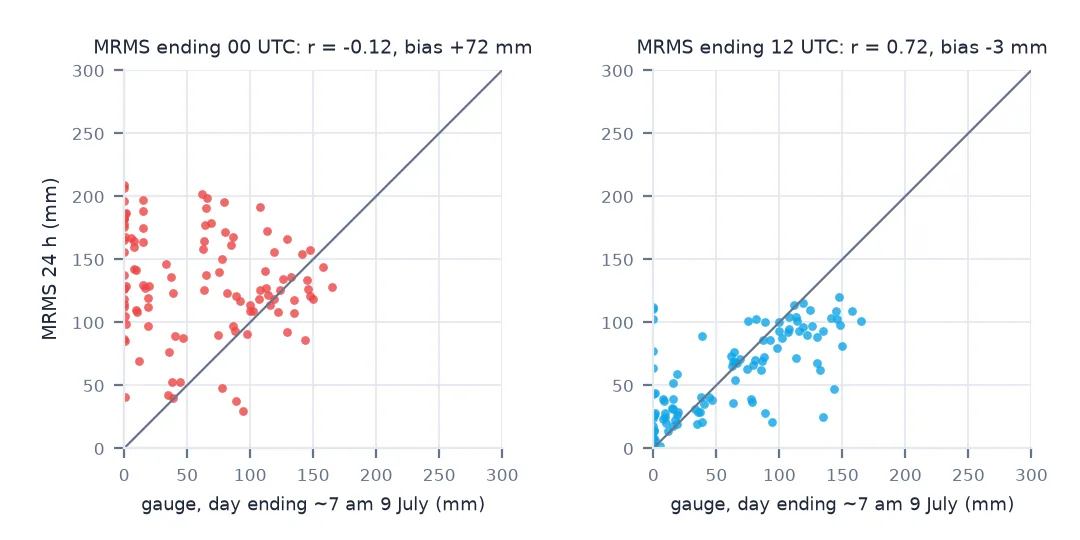
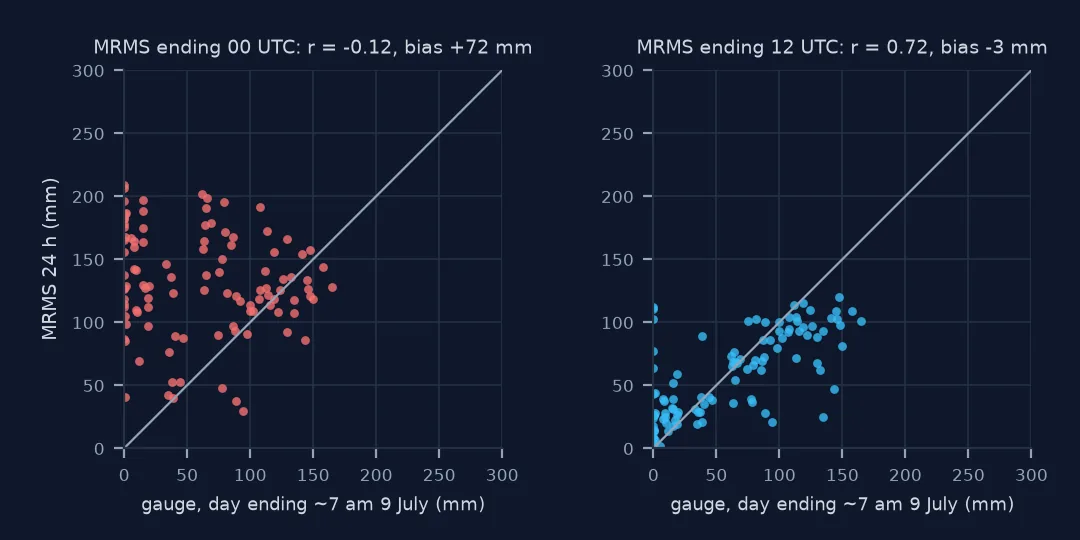
Gauges with attributes, each network's day, matched windows
1. Get the gauges with their attributes
The NCEI daily-summaries service returns GHCN-Daily values with their attribute string, whose fourth field — when present — is the observation time. It accepts up to 100 stations per request:
print(G.groupby("network").size().to_dict())
print(G.groupby("network")["obs_time"].agg(lambda s: s.value_counts().head(2).to_dict()).to_dict())
{'ASOS': 35, 'COOP': 46, 'CoCoRaHS': 435}
{'ASOS': {'not recorded': 20, '2400': 15}, 'COOP': {'not recorded': 15, '0700': 14}, 'CoCoRaHS': {'not recorded': 435}}
2. Know what each network's "day" is
- CoCoRaHS volunteers read their gauges at about 7 am local time and report the 24 hours ending then; the value is dated the day of the reading.
- COOP observers similarly report at a fixed morning or evening hour, recorded as 0700 or 0800 here.
- ASOS and other first-order stations report the calendar day in local standard time (2400).
In Houston in July, 7 am CDT is 12 UTC. So a CoCoRaHS total dated 9 July covers 12 UTC 8 July to 12 UTC 9 July — the MRMS product ending 12 UTC 9 July, not the one ending at 00 UTC.
3. Compare matched and mismatched windows
The quick answer shows the effect: r of −0.15 with the mismatched window, 0.77 with the matched one, for the same 90 gauges and the same rainfall product.
4. Check every network
rows = []
for network in ("CoCoRaHS", "COOP", "ASOS"):
    for date in ("2024-07-08", "2024-07-09"):
        for stamp in ("20240709-000000", "20240709-060000", "20240709-120000"):
            d = G[(G.network == network) & (G.DATE == date)]
            n, r, bias = compare(d, stamp)
            rows.append({"network": network, "gauge date": date, "MRMS end (UTC)": stamp[9:11], "n": n, "r": round(r, 2), "bias mm": round(bias, 1)})
table = pd.DataFrame(rows)
print(table.loc[table.groupby(["network", "gauge date"])["r"].idxmax()].to_string(index=False))
network gauge date MRMS end (UTC) n r bias mm
ASOS 2024-07-08 12 10 0.31 -66.9
ASOS 2024-07-09 06 6 0.69 145.7
COOP 2024-07-08 00 11 0.54 2.9
COOP 2024-07-09 06 11 0.45 97.0
CoCoRaHS 2024-07-08 00 95 0.57 24.4
CoCoRaHS 2024-07-09 12 90 0.77 -8.9
CoCoRaHS agrees best with its matched window by a wide margin. The ASOS stations, six to ten of them, give no consistent answer: the best correlation comes with a bias of 67 mm one way or 146 mm the other. Several recorded far less than MRMS during the storm's peak, and a sample this small cannot separate gauge undercatch in hurricane winds, data loss and radar error.
5. Find the gauges that did not report
A zero in the gauge column with a large radar total next to it is worth looking at before it enters a statistic:
q12 = mrms_24h("20240709-120000")
coco = coco.assign(mrms=q12.sel(latitude=xr.DataArray(coco.LATITUDE.values, dims="p"),
                                longitude=xr.DataArray(coco.LONGITUDE.values % 360, dims="p"), method="nearest").values)
odd = coco[(coco.PRCP < 5) & (coco.mrms > 60)]
print(odd[["STATION", "PRCP", "mrms"]].round(1).to_string(index=False))
print(G[G.STATION.isin(odd.STATION)][["STATION", "DATE", "PRCP"]].to_string(index=False))
STATION PRCP mrms
US1TXMNG063 0.0 110.599998
STATION DATE PRCP
US1TXMNG063 2024-07-07 0.0
US1TXMNG063 2024-07-08 0.0
US1TXMNG063 2024-07-09 0.0
A station reporting zero on every day of a hurricane is not measuring zero.
The comparison numbers a hydrologist would quote
The data used on this page
NOAA MRMS MultiSensor QPE Pass2, 24-hour accumulations ending 00, 06 and 12 UTC on 9 July 2024, from the NOAA MRMS archive on AWS; GHCN-Daily precipitation for CoCoRaHS, COOP and ASOS stations in south-east Texas from the NCEI daily-summaries service.
import gzip
import shutil
from pathlib import Path

import numpy as np
import pandas as pd
import requests
import xarray as xr

Path("data").mkdir(exist_ok=True)
INV = "https://www.ncei.noaa.gov/pub/data/ghcn/daily/ghcnd-inventory.txt"
if not Path("data/ghcnd-inventory.txt").exists():
    Path("data/ghcnd-inventory.txt").write_bytes(requests.get(INV, timeout=300).content)
inv = pd.read_fwf("data/ghcnd-inventory.txt", widths=[11, 9, 10, 5, 5, 5], names=["id", "lat", "lon", "el", "first", "last"])
ids = inv[(inv.el == "PRCP") & (inv["last"] >= 2024) & inv.lat.between(28.8, 30.4) & inv.lon.between(-96.3, -94.6)].id.unique()
if not Path("data/gauges.csv").exists():
    parts = []
    for i in range(0, len(ids), 90):
        r = requests.get("https://www.ncei.noaa.gov/access/services/data/v1", timeout=300, params={
            "dataset": "daily-summaries", "dataTypes": "PRCP", "stations": ",".join(ids[i:i + 90]),
            "startDate": "2024-07-07", "endDate": "2024-07-10", "format": "csv", "includeStationLocation": 1,
            "includeAttributes": "true", "units": "metric"})
        parts.append(r.text if not parts else r.text.split("\n", 1)[1])
    Path("data/gauges.csv").write_text("".join(parts))
G = pd.read_csv("data/gauges.csv").dropna(subset=["PRCP"])
G["network"] = G.STATION.str[:3].map({"US1": "CoCoRaHS", "USC": "COOP", "USW": "ASOS"})
G["obs_time"] = G.PRCP_ATTRIBUTES.fillna(",,,").str.split(",").str[3].fillna("").replace("", "not recorded")

def mrms_24h(stamp):
    name = f"MRMS_MultiSensor_QPE_24H_Pass2_00.00_{stamp}.grib2"
    if not Path("data", name).exists():
        url = f"https://noaa-mrms-pds.s3.amazonaws.com/CONUS/MultiSensor_QPE_24H_Pass2_00.00/{stamp[:8]}/{name}.gz"
        Path("data", name + ".gz").write_bytes(requests.get(url, timeout=300).content)
        with gzip.open(Path("data", name + ".gz")) as f, open(Path("data", name), "wb") as o:
            shutil.copyfileobj(f, o)
    q = xr.open_dataset(Path("data", name), engine="cfgrib", decode_timedelta=True, backend_kwargs={"indexpath": ""})["unknown"]
    return q.where(q >= 0)

print(len(ids), "stations;", len(G), "daily values")
241 stations; 516 daily values
Example 1: the matched comparison in numbers a hydrologist would quote
n, r, bias = compare(coco, "20240709-120000")
both = coco.dropna(subset=["mrms"])
ratio = both.mrms.sum() / both.PRCP.sum()
print(f"CoCoRaHS, matched window: n={n}, r={r:.2f}, mean bias {bias:+.1f} mm, MRMS/gauge total ratio {ratio:.2f}, "
      f"mean absolute difference {np.mean(np.abs(both.mrms - both.PRCP)):.1f} mm")
CoCoRaHS, matched window: n=90, r=0.77, mean bias -8.9 mm, MRMS/gauge total ratio 0.87, mean absolute difference 23.5 mm
Example 2: point against pixel
A gauge samples about 0.03 m²; an MRMS cell is about a square kilometre. Even with perfect timing, the two disagree where rain varies sharply, which is why the comparison is statistical, not gauge by gauge.
One estimate measured against another
Radar–gauge comparison is the measurement of one estimate against another, each with its own errors and its own definition of the quantity. The radar sees rain aloft over a square kilometre; the gauge catches it at a point on the ground, imperfectly in high wind. The overlap is good enough to validate and correct radar estimates — MRMS's own gauge correction does exactly that — but only if both describe the same time window.
Timing is the trap because it is invisible in the data. A GHCN-Daily value is dated, not time-stamped; its day ends when the observer read the gauge, which differs by network and sometimes by station, and the observation time is only sometimes recorded in the attributes. Matching windows turned a correlation of −0.15 into 0.77 here — not because the data changed, but because the comparison finally asked both sources about the same 24 hours.
Observer days, observation times and undercatch
- CoCoRaHS days end at about 7 am local; ASOS days at local midnight standard time.
- Read the observation time from the attribute string where it is recorded.
- Zeros during a storm can mean no report; check neighbouring days.
- Wind undercatch makes gauges read low in hurricanes.
- Point vs pixel: expect scatter even with perfect timing.
- Use the gauge-corrected product cautiously for validation: it has already seen some of the same gauges.
Internal links
- How to read MRMS rainfall from GRIB2 — the radar side
- Radar rainfall vs gauges explained — why they differ
- How to build a rain-gauge network dataset — the gauge side
- Rainfall accumulation has gaps — missing and multi-day totals
- How to analyse snow depth from GHCN-Daily — the same attribute flags
FAQ
Why does my radar rainfall not match the rain gauges?
Most often the time windows differ: GHCN-Daily gauge days end at the observer's reading time (about 7 am local for CoCoRaHS), while radar products are usually totalled to UTC hours.
How do I match MRMS to CoCoRaHS gauges?
Use the MRMS 24-hour product ending at the CoCoRaHS reading time — 12 UTC for 7 am Central Daylight Time — and compare it with the value dated the day of the reading.
What is the observation time in GHCN-Daily?
The fourth field of the attribute string, when present (for example 0700 or 2400); CoCoRaHS values often leave it blank but follow the 7 am convention.
How well did MRMS match the gauges for Hurricane Beryl?
Against 90 CoCoRaHS gauges with matched windows, r = 0.77 with a mean bias of about −9 mm; with the window ending 12 hours earlier, r = −0.15.