
How to Map Coral Bleaching Heat Stress with Degree Heating Weeks in Python
On this page
Problem statement
Coral Reef Watch's heat-stress grid covers the whole Coral Sea at 5 km, most of it open water. A reef manager's question is narrower: on a given day, how many of the Marine Park's 3,861 reefs have passed 4 °C-weeks, where bleaching becomes likely, or 8, where severe bleaching and deaths are expected — and are they in the north, the centre or the south? Answering it means putting each reef on its nearest ocean pixel and counting, which on 18 March 2024 put 85% of them past the first threshold.
This page downloads Coral Reef Watch DHW for the Great Barrier Reef during the 2024 mass bleaching, samples it at the 3,861 reefs in the Great Barrier Reef Marine Park Authority's reef features dataset, measures how many reached each threshold, and follows heat stress through the summer.
Quick answer
Download the DHW field for a day, take the value at each reef's nearest ocean pixel, and count reefs above 4 and 8 °C-weeks:
dhw = crw("degree_heating_week", "2024-03-18", "2024-03-18").squeeze("time")
R["dhw"] = sample(dhw, R)
print(f"reefs: {len(R):,}; DHW on 18 March 2024: median {R.dhw.median():.1f} °C-weeks, max {R.dhw.max():.1f}")
print(f"at or above 4 (bleaching likely): {(R.dhw >= 4).mean():.0%}; at or above 8 (severe bleaching and mortality likely): {(R.dhw >= 8).mean():.0%}")
reefs: 3,861; DHW on 18 March 2024: median 7.2 °C-weeks, max 16.7
at or above 4 (bleaching likely): 85%; at or above 8 (severe bleaching and mortality likely): 38%
On 18 March 2024, the median reef had accumulated 7.2 °C-weeks of heat stress and the most stressed 16.7. 85% of the 3,861 reefs were at or above 4 °C-weeks, where significant bleaching is likely, and 38% at or above 8, where severe bleaching and mortality are expected.
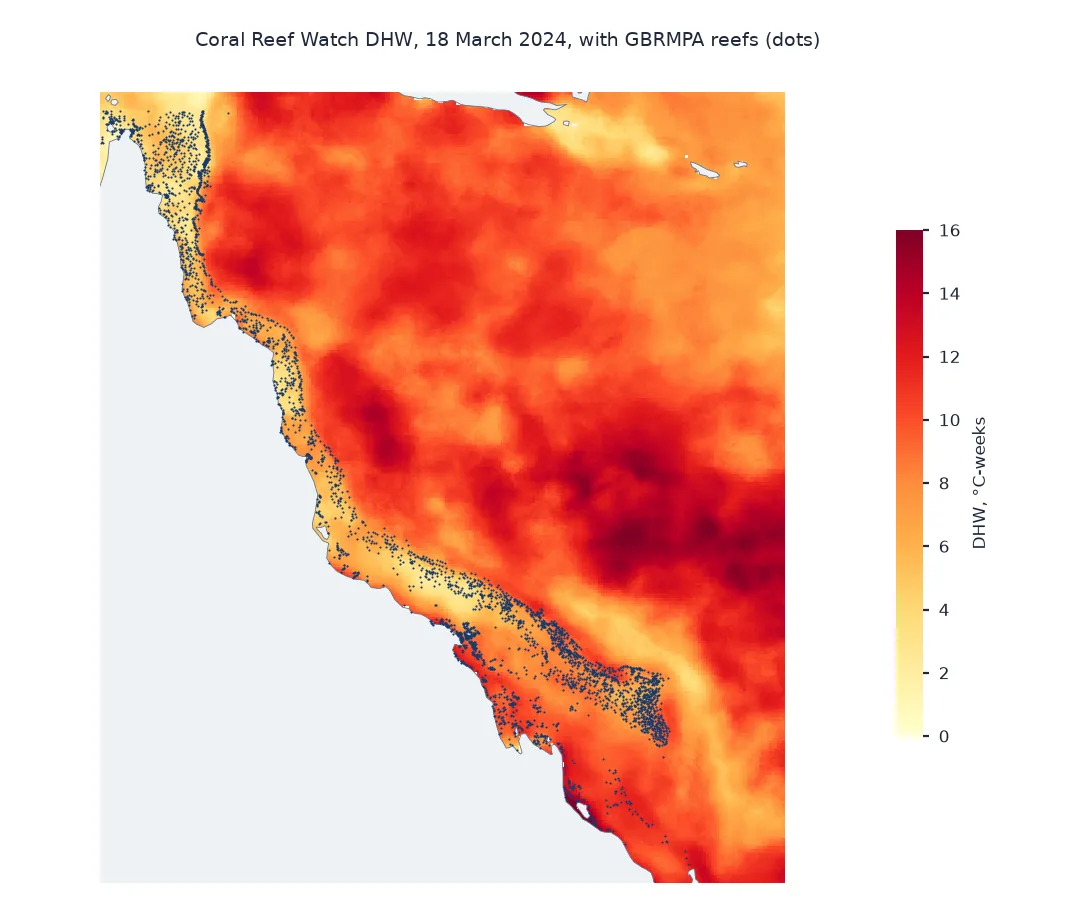
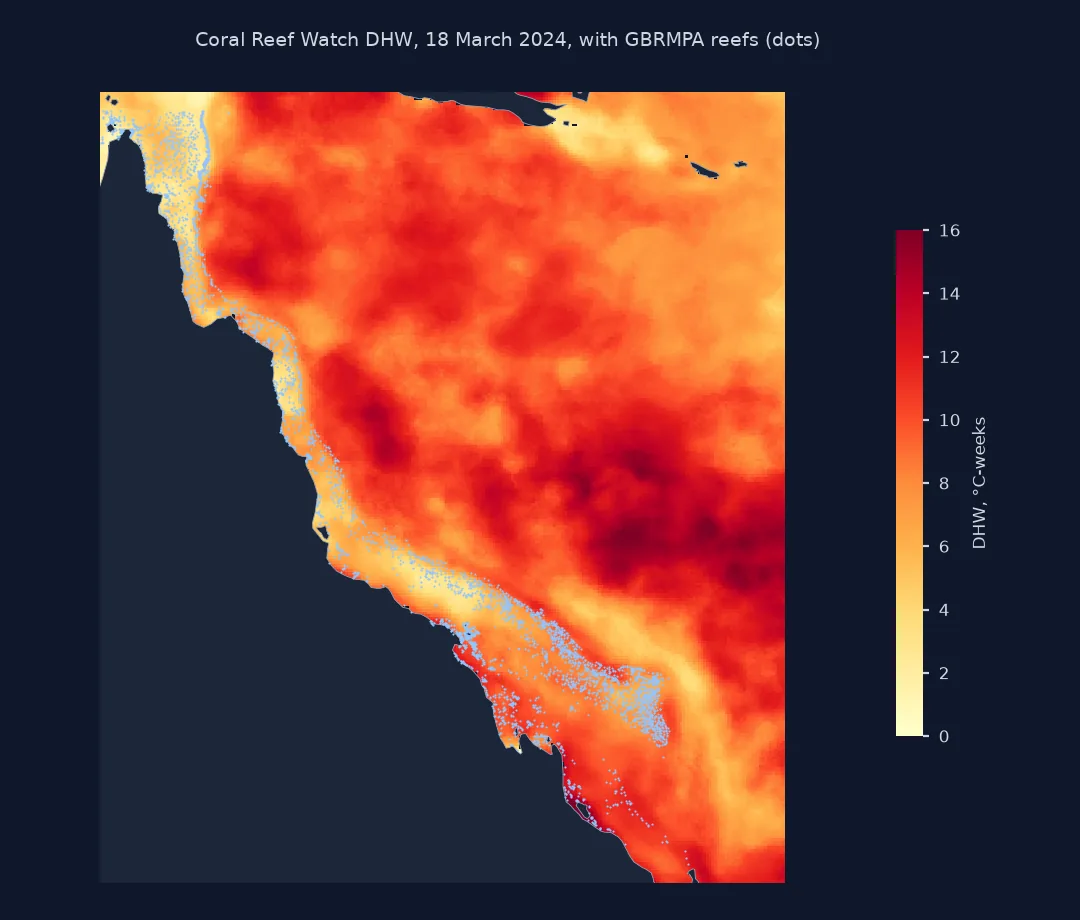
Where the reefs are, sample the grid there, compare regions
1. Where the reefs are
GBRMPA publishes every reef, island, cay and rock in the Marine Park as a feature with a label point. Keep the reefs:
print(f"features: {len(F):,}; types: {F.FEAT_NAME.value_counts().to_dict()}")
print(f"reefs from {R.Y_COORD.min():.2f} to {R.Y_COORD.max():.2f} degrees latitude; named: {(R.GBR_NAME != 'U/N Reef').sum():,}")
features: 5,362; types: {'Reef': 3862, 'Island': 884, 'Rock': 360, 'Cay': 254, 'Mainland': 1, 'Sand': 1}
reefs from -24.64 to -10.35 degrees latitude; named: 1,635
The service holds 5,362 features, of which 3,862 are reefs, along with 884 islands, 360 rocks and 254 cays. The reefs run from 24.64°S to 10.35°S, and 1,635 of them have names; the rest are labelled "U/N Reef", unnamed.
2. Sample the grid at the reefs
Coral Reef Watch masks land, and many reefs sit next to it or are smaller than a 5 km pixel, so the pixel under a reef's label point is sometimes empty. Take the nearest valid pixel and record how far it was:
print(f"DHW grid: {dhw.sizes['latitude']} x {dhw.sizes['longitude']} pixels of {float(abs(dhw.latitude[1] - dhw.latitude[0])):.2f}°; valid {int(dhw.notnull().sum()):,}")
own = dhw.sel(latitude=xr.DataArray(R.Y_COORD), longitude=xr.DataArray(R.X_COORD), method="nearest").values
print(f"reefs whose own pixel is masked: {np.isnan(own).sum():,} ({np.isnan(own).mean():.0%}); furthest nearest valid pixel {R.dist_km.max():.1f} km")
print(f"open-water pixels in the box at or above 8: {float((dhw >= 8).sum() / dhw.notnull().sum()):.0%}, against {(R.dhw >= 8).mean():.0%} of reefs")
DHW grid: 301 x 260 pixels of 0.05°; valid 51,000
reefs whose own pixel is masked: 7 (0%); furthest nearest valid pixel 4.1 km
open-water pixels in the box at or above 8: 73%, against 38% of reefs
The box is 301 by 260 pixels of 0.05°, of which 51,000 hold data. Only 7 reefs have a masked pixel under their label point, and none is more than 4.1 km from a valid one, so the nearest-pixel rule moves almost nothing here. The comparison with open water matters more: 73% of the box's pixels were at 8 or more, against 38% of reefs, so a map's share of red pixels overstates the share of reefs affected.
3. North, centre and south
The Marine Park is 2,300 km long. Split the reefs at 16°S and 20°S, roughly Cooktown and the Whitsundays, and compare:
R["region"] = pd.cut(R.Y_COORD, [-25, -20, -16, -9], labels=["southern", "central", "northern"])
print(R.groupby("region", observed=True).dhw.agg(reefs="size", median="median", share_4=lambda d: f"{(d >= 4).mean():.0%}",
                                                  share_8=lambda d: f"{(d >= 8).mean():.0%}").to_string())
reefs median share_4 share_8
region
southern 1877 8.69 100% 69%
central 725 6.39 87% 16%
northern 1259 4.54 60% 5%
Heat stress was worst in the south. All 1,877 southern reefs reached 4 °C-weeks and 69% reached 8, with a median of 8.69. In the central section 16% reached 8, and in the north only 5%, with a median of 4.54.
Heat stress through the summer
The data used on this page
NOAA Coral Reef Watch version 3.1 daily 5 km Degree Heating Weeks, from NOAA CoastWatch's ERDDAP (noaacrwdhwDaily), and the Great Barrier Reef Marine Park Authority's Great Barrier Reef Features service.
from pathlib import Path

import numpy as np
import pandas as pd
import requests
import xarray as xr
from scipy.spatial import cKDTree

Path("data").mkdir(exist_ok=True)
def crw(var, t0, t1, stride=1, lat=(-9.975, -24.975), lon=(142.025, 154.975)):
    p = Path(f"data/crw_{var}_{t0}_{t1}_{stride}.nc")
    if not p.exists():
        q = f"{var}[({t0}T12:00:00Z):{stride}:({t1}T12:00:00Z)][({lat[0]}):1:({lat[1]})][({lon[0]}):1:({lon[1]})]"
        r = requests.get(f"https://coastwatch.noaa.gov/erddap/griddap/noaacrwdhwDaily.nc?{q}", timeout=900)
        r.raise_for_status()
        p.write_bytes(r.content)
    return xr.open_dataset(p)[var]
g = Path("data/gbr_features.csv")
if not g.exists():
    url = "https://services-ap1.arcgis.com/8gXWSCxaJlFIfiTr/arcgis/rest/services/Great_Barrier_Reef_Features_20/FeatureServer/64/query"
    rows, offset = [], 0
    while True:
        d = requests.get(url, timeout=120, params={"where": "1=1", "outFields": "FEAT_NAME,GBR_NAME,X_COORD,Y_COORD,GBR_ID",
                                                   "returnGeometry": "false", "f": "json", "resultOffset": offset}).json()
        rows += [f["attributes"] for f in d["features"]]; offset += len(d["features"])
        if not d.get("exceededTransferLimit"):
            break
    pd.DataFrame(rows).to_csv(g, index=False)
F = pd.read_csv(g)
R = F[F.FEAT_NAME == "Reef"].dropna(subset=["X_COORD", "Y_COORD"]).reset_index(drop=True)
def sample(da, pts):
    """Value of the nearest valid pixel to each point; distances go into pts.dist_km."""
    lat, lon = np.meshgrid(da.latitude.values, da.longitude.values, indexing="ij")
    ok = np.isfinite(da.values)
    tree = cKDTree(np.c_[lat[ok], lon[ok] * np.cos(np.radians(-18))])
    dist, idx = tree.query(np.c_[pts.Y_COORD, pts.X_COORD * np.cos(np.radians(-18))])
    pts["dist_km"] = dist * 111.32
    return da.values[ok][idx]
print(f"{len(F):,} features, {len(R):,} reefs with a label point ({int((F.FEAT_NAME == 'Reef').sum()) - len(R)} without)")
5,362 features, 3,861 reefs with a label point (1 without)
Example 1: heat stress through the summer
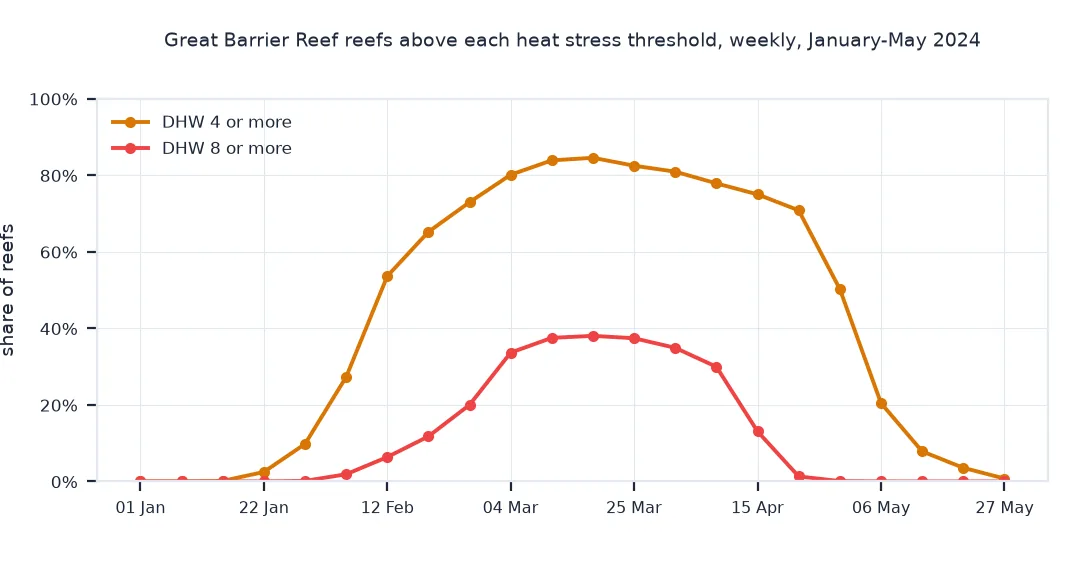
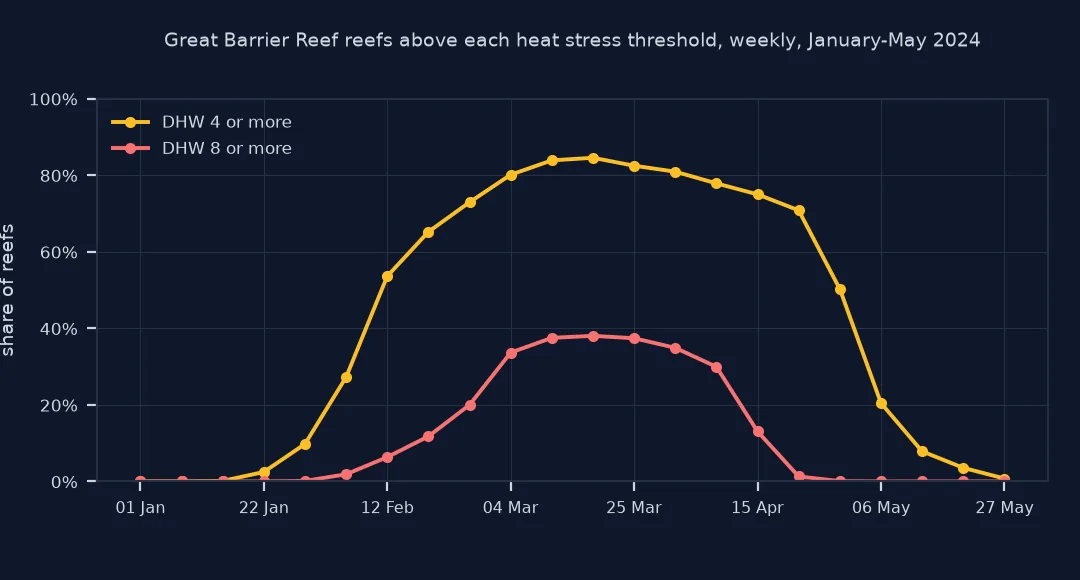
Take one field a week from January to May 2024 and follow the share of reefs above each threshold:
wk = crw("degree_heating_week", "2024-01-01", "2024-05-27", stride=7)
rows = {}
for t in pd.DatetimeIndex(wk.time.values):
    v = sample(wk.sel(time=t), R.copy())
    rows[t.strftime("%d %b")] = {"median": np.median(v), "4+": np.mean(v >= 4), "8+": np.mean(v >= 8)}
S = pd.DataFrame(rows).T
print(S.iloc[::3].round(2).to_string())
print(f"peak share at 8 or more: {S['8+'].max():.0%} on {S['8+'].idxmax()}")
median 4+ 8+
01 Jan 0.00 0.00 0.00
22 Jan 1.41 0.02 0.00
12 Feb 4.17 0.54 0.06
04 Mar 6.91 0.80 0.34
25 Mar 7.04 0.82 0.37
15 Apr 6.02 0.75 0.13
06 May 3.16 0.20 0.00
27 May 0.30 0.01 0.00
peak share at 8 or more: 38% on 18 Mar
Heat stress built from nothing on 1 January to a median of 4.17 °C-weeks by 12 February, when 54% of reefs had passed 4. The share at 8 or more peaked at 38% on 18 March and had fallen to zero by 6 May, as the 12-week window moved past the hottest weeks of the summer.
Bleaching follows heat that lasts
Coral bleaching is the loss of the symbiotic algae that give corals their colour and most of their food, and its main cause is heat that lasts. Coral Reef Watch's measure reflects that. For each 5 km pixel it computes the maximum monthly mean (MMM): the mean temperature of the warmest month in a baseline climatology. A HotSpot is today's temperature above the MMM; DHW adds up HotSpots of at least 1 °C over the last 84 days and divides by seven, so the unit is °C-weeks. Two weeks at 2 °C above the summer maximum give 4 °C-weeks, the level at which significant bleaching is likely; eight °C-weeks is where severe bleaching and mortality are expected.
Sampling at reefs matters because the measure is about corals, and most of a 5 km grid over the Great Barrier Reef is open water or lagoon. Reefs cluster on the shelf, where heat stress can differ from the deep water beyond it: on 18 March 2024, 73% of valid pixels in the box were at 8 °C-weeks or more, against 38% of reefs: the box as a whole, most of it water without reefs, was more heat-stressed than the reefs themselves. Using reef locations from the managing authority turns a map of the sea into a count of reefs, the number that reef managers and surveys report.
A stress index, versions and masked pixels
- DHW is a stress index, not bleaching: whether corals bleach depends on species, depth, light and history; aerial and in-water surveys measure what actually happened.
- Version: the current product suite is version 3.1; numbers from older versions and from regional products differ.
- Masked pixels: Coral Reef Watch masks land and some shallow coastal pixels; on this coast only 7 reefs fall in a masked pixel, and the furthest nearest valid pixel is 4.1 km away; along more complex coasts, check the distances.
- Reef points: GBRMPA label points are inside each reef's outline but are points; large reefs span several pixels and could be summarised by their maximum instead.
Internal links
- Degree heating weeks explained — how the measure is built
- How to detect marine heatwaves in Python — the general-purpose definition
- How to download NOAA OISST sea surface temperature in Python — another daily SST product
FAQ
What are degree heating weeks?
Coral Reef Watch's measure of accumulated heat stress: the sum, over the last 12 weeks, of daily temperatures at least 1 °C above the warmest month's mean, divided by seven, in °C-weeks.
What DHW causes coral bleaching?
Significant bleaching is likely from 4 °C-weeks, and severe, widespread bleaching with significant mortality from 8 °C-weeks, according to Coral Reef Watch.
How do I download Coral Reef Watch data in Python?
Request a subset of the noaacrwdhwDaily dataset from NOAA CoastWatch's ERDDAP as NetCDF, and open it with xarray.
How much of the Great Barrier Reef had severe heat stress in 2024?
By Coral Reef Watch DHW sampled at GBRMPA's 3,861 reefs, 38% were at or above 8 °C-weeks on 18 March 2024, the peak of the summer, and 85% at or above 4. In the southern third of the reef 69% reached 8.