
How to lay out a soil sampling grid in Python
Problem statement
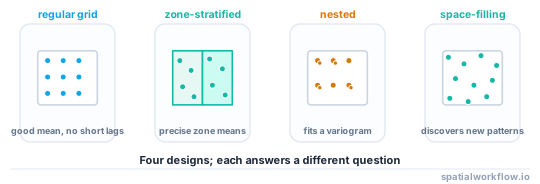
Soil sampling is expensive per point and the layout decides what the samples can tell you. A regular grid estimates a mean well and a spatial pattern poorly; a zone-based design characterises known zones and cannot discover new ones; a design with no short-distance pairs cannot fit a variogram, so nothing can be interpolated from it afterwards.
The number of samples is usually fixed by budget. The question this guide answers is where to put them, given what the samples are for — and the answer differs for a mean, a map, and a set of management zones.
Quick answer
A regular grid with a random offset, clipped to the field and pulled in from the boundary:
import numpy as np, geopandas as gpd
from shapely.geometry import Point

def grid_samples(field, spacing_m, inset_m=15, seed=0):
    rng = np.random.default_rng(seed)
    poly = field.buffer(-inset_m)
    minx, miny, maxx, maxy = poly.bounds
    ox, oy = rng.uniform(0, spacing_m, 2)               # random origin, not a fixed one
    xs = np.arange(minx + ox, maxx, spacing_m)
    ys = np.arange(miny + oy, maxy, spacing_m)
    pts = [Point(x, y) for x in xs for y in ys]
    g = gpd.GeoDataFrame(geometry=[p for p in pts if poly.contains(p)], crs=field.crs)
    g["sample_id"] = [f"S{i + 1:03d}" for i in range(len(g))]
    return g
The inset matters: headlands are compacted, differently fertilised and unrepresentative, and a sample taken fifteen metres from a hedge is a sample of the hedge.
Step-by-step solution
1. Decide what the samples are for
- A field mean for a lime or phosphate recommendation: a regular or random grid, enough points to hit the precision you need.
- A map to interpolate: a grid plus clustered pairs at short lags, or the variogram cannot be fitted.
- Zone characterisation: stratified by zone, with enough points per zone to estimate each mean.
- Discovering new patterns: a space-filling design that does not assume the zones.
2. Choose the spacing from the budget and the field
A 100 m grid on a 25 ha field is about 25 points; a 75 m grid is about 44. Published guidance for phosphorus and potassium mapping is usually 60–100 m, and the honest position is that the right spacing depends on the range of the variogram, which you do not know until you have sampled.
3. Randomise the grid origin
A fixed origin aligned with the field's corner risks aligning with tramlines, drainage runs or previous applications. A random offset costs nothing and removes the risk.
4. Inset from the boundary
Fifteen to twenty metres. Headlands are consistently different and they are usually managed separately anyway.
5. Add short-lag pairs if a map is wanted
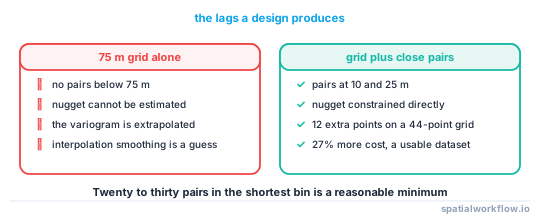
A regular grid has a minimum lag equal to its spacing, so the variogram has no points below it and the nugget cannot be separated from the short-range structure. Adding a handful of close pairs — two points 10 and 25 m apart at a subset of grid nodes — fixes it cheaply.
6. Stratify by zone if the zones already exist
Allocate points proportionally to area, with a minimum per zone, and randomise within each zone. That gives a defensible mean per zone and keeps the coverage.
7. Produce a navigable file with stable identifiers
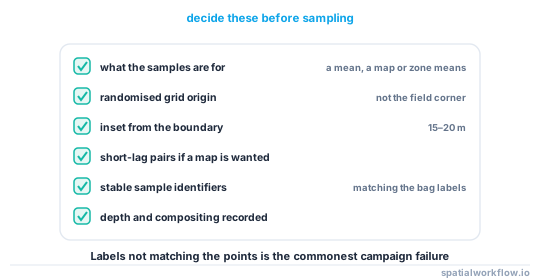
Points with an identifier, in a format the field computer reads, with the identifier printed on the bag label. The commonest cause of a ruined sampling campaign is the labels not matching the points.
Code examples
Example 1 — grid, stratified and space-filling designs
import numpy as np, geopandas as gpd
from shapely.geometry import Point

def random_points_in(poly, n, rng, max_tries=200):
    minx, miny, maxx, maxy = poly.bounds
    out = []
    for _ in range(max_tries * n):
        p = Point(rng.uniform(minx, maxx), rng.uniform(miny, maxy))
        if poly.contains(p):
            out.append(p)
            if len(out) == n:
                break
    return out

def stratified_samples(field, zones, n_total, min_per_zone=4, inset_m=15, seed=0):
    rng = np.random.default_rng(seed)
    z = gpd.overlay(zones, gpd.GeoDataFrame(geometry=[field.buffer(-inset_m)],
                                            crs=zones.crs), how="intersection")
    z["area"] = z.area
    share = z["area"] / z["area"].sum()
    n = np.maximum((share * n_total).round().astype(int), min_per_zone)

    rows = []
    for (_, row), k in zip(z.iterrows(), n):
        for p in random_points_in(row.geometry, int(k), rng):
            rows.append({"zone": row.get("zone"), "geometry": p})
    g = gpd.GeoDataFrame(rows, crs=zones.crs)
    g["sample_id"] = [f"S{i + 1:03d}" for i in range(len(g))]
    print(g.groupby("zone").size().to_string())
    return g

def space_filling(field, n, inset_m=15, seed=0, candidates=5000):
    """Maximin: greedily pick points that are as far as possible from those chosen."""
    rng = np.random.default_rng(seed)
    poly = field.buffer(-inset_m)
    cand = np.array([[p.x, p.y] for p in random_points_in(poly, candidates, rng)])
    chosen = [int(rng.integers(len(cand)))]
    d = np.hypot(*(cand - cand[chosen[0]]).T)
    for _ in range(n - 1):
        nxt = int(d.argmax())
        chosen.append(nxt)
        d = np.minimum(d, np.hypot(*(cand - cand[nxt]).T))
    return gpd.GeoDataFrame(
        {"sample_id": [f"S{i + 1:03d}" for i in range(n)]},
        geometry=[Point(*cand[i]) for i in chosen], crs=field.crs)
Example 2 — check the lag distribution before sampling
import numpy as np
from scipy.spatial.distance import pdist

def lag_profile(points, bins=(0, 20, 50, 100, 200, 400, 800)):
    xy = np.c_[points.geometry.x, points.geometry.y]
    d = pdist(xy)
    counts, edges = np.histogram(d, bins=bins)
    print(f"{len(points)} points, {len(d):,} pairs, "
          f"minimum separation {d.min():.1f} m")
    for lo, hi, c in zip(edges[:-1], edges[1:], counts):
        print(f"  {lo:>4.0f}–{hi:<4.0f} m: {c:5,} pairs")
    if counts[0] < 20:
        print("  ! too few short-lag pairs to fit a nugget")
    return counts, edges
Twenty to thirty pairs in the shortest bin is a reasonable minimum for fitting a nugget. A pure 75 m grid has zero.
Example 3 — add short-lag pairs cheaply
import numpy as np, geopandas as gpd
from shapely.geometry import Point

def add_close_pairs(points, n_pairs=6, distances=(10, 25), seed=0):
    rng = np.random.default_rng(seed)
    pick = rng.choice(len(points), size=min(n_pairs, len(points)), replace=False)
    extra = []
    for i in pick:
        p = points.geometry.iloc[i]
        for dist in distances:
            angle = rng.uniform(0, 2 * np.pi)
            extra.append(Point(p.x + dist * np.cos(angle), p.y + dist * np.sin(angle)))
    g = gpd.GeoDataFrame(geometry=extra, crs=points.crs)
    g["sample_id"] = [f"P{i + 1:03d}" for i in range(len(g))]
    out = gpd.pd.concat([points, g], ignore_index=True)
    print(f"{len(points)} grid points + {len(g)} close points = {len(out)}")
    return out
Twelve extra points on a 44-point grid is a 27% increase in cost that turns an un-interpolatable dataset into an interpolatable one — which is usually a better use of the budget than tightening the grid.
Explanation
Why a regular grid cannot fit a variogram
A variogram is estimated from pairs binned by separation. A grid with 75 m spacing has no pairs closer than 75 m, so the model must be extrapolated to the origin to estimate the nugget — and the nugget is what determines how much the interpolation smooths. Adding pairs at 10 and 25 m constrains it directly, which is why nested and clustered designs exist.
Why the grid origin should be random
A field's features are often periodic: tramlines at the boom width, drainage runs at a fixed spacing, previous applications aligned with the same tramlines. A grid whose origin is the field corner and whose spacing happens to be a multiple of the tramline spacing samples the same position in every pass, which is the worst possible alignment. A random offset makes that a coincidence rather than a certainty.
Why to inset from the boundary
Headlands are turned on, compacted, double-fertilised and shaded by hedges. Their soil is genuinely different, and including them in a field mean biases it. If the headland is of interest, sample it as its own stratum rather than letting it contaminate the field.
Why stratification and discovery pull in opposite directions
Stratifying by existing zones gives precise estimates of those zones' means and, by construction, no information about whether the zones are right. A space-filling design spreads points to cover the field's variation without assuming a structure, which is what you want when the zones are the question. Doing both means splitting the budget.
Edge cases or notes
- Buffering inwards can empty a narrow field. Check for an empty polygon.
- Composite samples of several cores per point are standard; record the pattern.
- Depth matters. A 0–15 cm and a 15–30 cm sample are different variables.
- Sample identifiers must match the labels. This is the commonest campaign failure.
- Record the sampling date. Nutrient levels move through a season.
- Keep the design file. Resampling the same points later is far more informative.
- Access constraints — wet spots, standing crop — will move points; record where they went.
- Report the achieved spacing, not the designed one.
Internal links
- Management zones explained — the strata to sample by
- How to build management zones with clustering in Python — producing the zones
- Sample design explained — the statistical background
- The variogram explained — why short lags matter
- How to do IDW interpolation in Python — interpolating the results
- How to do kriging in Python — where the variogram is used
- How to choose a cell size for interpolation — the output grid
- How to create a fishnet grid in GeoPandas — the grid geometry
FAQ
What spacing should I use for soil sampling?
Sixty to a hundred metres is common for phosphorus and potassium mapping, but the right answer depends on the variogram range, which you do not know until you have sampled.
Should the grid origin be fixed?
No. Randomise it, so the grid cannot align with tramlines, drainage runs or previous applications.
Why inset from the field boundary?
Headlands are compacted, differently fertilised and shaded. Sample them as their own stratum if they matter, not as part of the field.
Why can I not interpolate my grid samples?
Because a regular grid has no pairs closer than its spacing, so the variogram nugget cannot be estimated. Add a few pairs at 10 and 25 m.
Should I stratify by management zone?
If the zones are established and you want their means, yes. If you want to discover whether the zones are right, use a space-filling design instead.
How many samples per zone?
Proportional to area, with a minimum of about four so each zone mean has some precision.