
How to Count Crime on Street Segments in Python
On this page
Problem statement
Community areas and census tracts are too coarse for much of what crime analysis needs. The research on crime and place works at the level of the street segment, both sides of a street between two intersections, because that is the scale at which people use places and at which crime concentrates. City data rarely comes with segments attached. Building them means turning a street network into intersection-to-intersection pieces, snapping each incident to one, and keeping the segments with no crime, which are most of them.
This page builds street segments for Chicago from the Census Bureau's TIGER/Line edges with momepy, snaps every 2024 recorded incident to its nearest segment, measures how far the snapped points moved and how many sat exactly on an intersection, and compares segments by count and by count per length.
Quick answer
Snap each incident to the nearest segment within a tolerance, count per segment, and add back the segments with none:
j = gpd.sjoin_nearest(PTS, SEG[["geometry"]], max_distance=200, distance_col="moved_ft")
TIED = j.index[j.index.duplicated(keep=False)].nunique()
j = j[~j.index.duplicated(keep="first")]                              # a point on an intersection touches several segments
SEG["incidents"] = j.groupby("index_right").size().reindex(SEG.index, fill_value=0)
top = SEG.incidents.sort_values(ascending=False)
print(f"{len(SEG):,} segments; with at least one incident: {(SEG.incidents > 0).mean():.1%}")
print(f"incidents snapped: {len(j):,} of {len(PTS):,}; the busiest 1% of segments hold {top.head(len(SEG) // 100).sum() / top.sum():.1%}")
47,057 segments; with at least one incident: 68.6%
incidents snapped: 256,271 of 257,524; the busiest 1% of segments hold 15.8%
Almost a third of the city's 47,057 segments, 31.4%, had no recorded incident in 2024, and the busiest 1%, 470 segments, held 15.8% of all incidents.
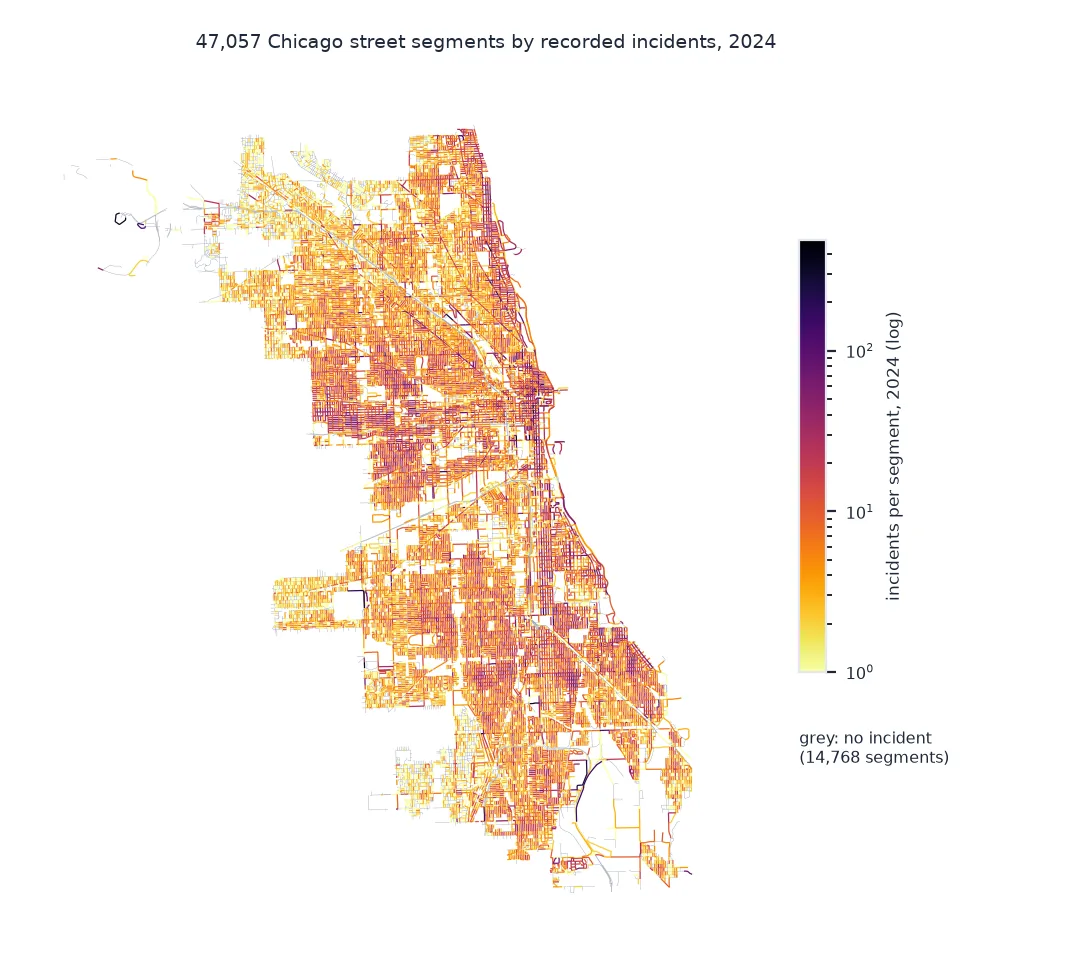
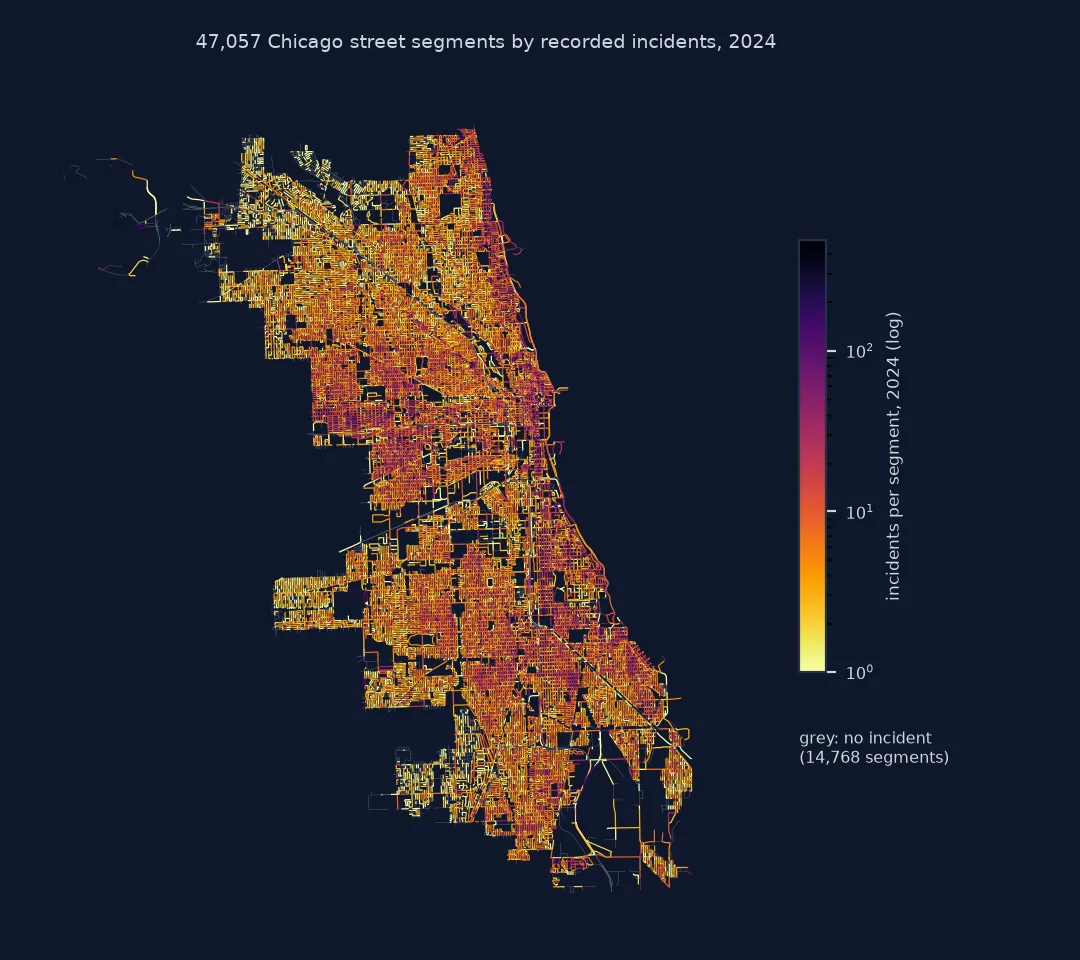
Segments from the street network, point shifts, counts per length
1. Build segments from the street network
TIGER/Line edges are split wherever any feature meets a street: an alley, a rail line, a boundary. Keep the road classes, then merge edges that meet at nodes where only two of them join, so each piece runs from one street intersection to the next:
print(f"road edges near the city: {len(ROADS):,}; after removing false nodes: {len(MERGED):,}; inside the city: {len(SEG):,}")
print(f"segment length: median {SEG.length.median():.0f} ft, middle half {SEG.length.quantile(0.25):.0f}-{SEG.length.quantile(0.75):.0f} ft")
road edges near the city: 80,583; after removing false nodes: 48,118; inside the city: 47,057
segment length: median 348 ft, middle half 330-663 ft
Merging at false nodes turns 80,583 road edges into 48,118 pieces. The typical segment is 348 feet long, the short side of a Chicago block, and the middle half run from 330 to 663 feet, one or two blocks.
2. Check how far the points moved
Chicago's points are already placed on street centrelines at the block level, so snapping should barely move them. Check, and count the points that sit exactly at an intersection, where the nearest segment is a tie:
print(f"distance moved: median {j.moved_ft.median():.2f} ft, 99th percentile {j.moved_ft.quantile(0.99):.1f} ft")
print(f"incidents equidistant from two or more segments: {TIED:,} ({TIED / len(j):.1%})")
print(f"beyond 200 ft of any segment: {len(PTS) - len(j):,}")
distance moved: median 0.30 ft, 99th percentile 30.7 ft
incidents equidistant from two or more segments: 6 (0.0%)
beyond 200 ft of any segment: 1,253
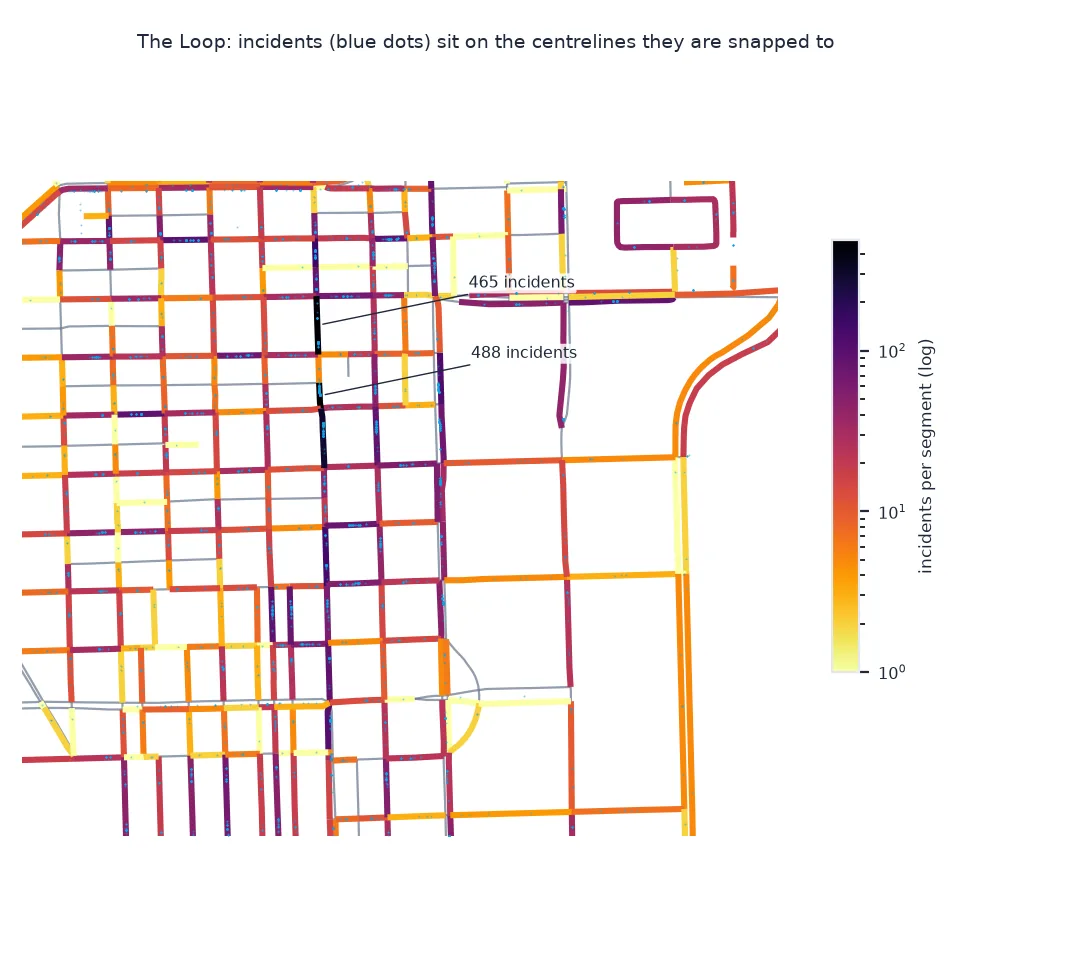
Half the points moved less than a third of a foot: they were already on the centreline. Only six incidents sat exactly between two segments, and 1,253, about 0.5%, were more than 200 feet from any street and are left out.
3. Compare counts and counts per length
Long segments collect more incidents simply by being long. Incidents per 100 feet levels that, though very short segments then give extreme values from a single incident:
SEG["per_100ft"] = SEG.incidents / SEG.length * 100
busy = SEG[SEG.incidents > 0]
print(f"rank correlation of count and per-100-ft density on segments with incidents: {busy.incidents.corr(busy.per_100ft, method='spearman'):.2f}")
print(f"segments under 50 ft: {(SEG.length < 50).sum():,}; among the top 100 by density: {(SEG.nlargest(100, 'per_100ft').length < 50).sum()}")
rank correlation of count and per-100-ft density on segments with incidents: 0.89
segments under 50 ft: 814; among the top 100 by density: 1
Count and density agree closely on segments with incidents, with a rank correlation of 0.89. The 814 segments shorter than 50 feet could have dominated the density ranking; only one reaches its top 100.
The busiest segments
The data used on this page
The City of Chicago's Crimes - 2001 to Present (ijzp-q8t2), incidents dated 2024 with coordinates; the Census Bureau's TIGER/Line 2023 edges for Cook County (tl_2023_17031_edges), road classes S1100, S1200 and S1400; and the community area boundaries dissolved into the city outline. Coordinates are EPSG:3435, in US survey feet.
from pathlib import Path

import geopandas as gpd
import momepy
import pandas as pd
import requests

Path("data").mkdir(exist_ok=True)
URL = "https://data.cityofchicago.org/resource/ijzp-q8t2.json"
F = Path("data/chicago_crimes_2024.parquet")
if not F.exists():
    rows, offset = [], 0
    while True:
        part = requests.get(URL, timeout=300, params={
            "$where": "year=2024", "$limit": 50_000, "$offset": offset, "$order": "id",
            "$select": "id,date,primary_type,arrest,domestic,community_area,latitude,longitude,location_description,block,updated_on"}).json()
        rows += part; offset += len(part)
        if len(part) < 50_000:
            break
    pd.DataFrame(rows).to_parquet(F)
SRC = {"chicago_community_areas.geojson": "https://data.cityofchicago.org/resource/igwz-8jzy.geojson?$limit=100",
       "tl_2023_17031_edges.zip": "https://www2.census.gov/geo/tiger/TIGER2023/EDGES/tl_2023_17031_edges.zip"}
for name, url in SRC.items():
    if not Path("data", name).exists():
        Path("data", name).write_bytes(requests.get(url, timeout=600).content)

CITY = gpd.read_file("data/chicago_community_areas.geojson").to_crs(3435).union_all()
edges = gpd.read_file("data/tl_2023_17031_edges.zip", columns=["TLID", "FULLNAME", "MTFCC"])
ROADS = edges[edges.MTFCC.isin(["S1100", "S1200", "S1400"])].to_crs(3435)
ROADS = ROADS[ROADS.intersects(CITY.buffer(500))].reset_index(drop=True)
MERGED = momepy.remove_false_nodes(ROADS[["FULLNAME", "geometry"]])
SEG = MERGED[MERGED.intersects(CITY)].reset_index(drop=True)
c = pd.read_parquet(F).dropna(subset=["latitude", "longitude"])
PTS = gpd.GeoDataFrame(c, geometry=gpd.points_from_xy(c.longitude.astype(float), c.latitude.astype(float)), crs=4326).to_crs(3435)
print(f"{len(PTS):,} incidents; {len(SEG):,} street segments")
257,524 incidents; 47,057 street segments
Example 1: the busiest segments
momepy drops the street name where it merges edges, so name each segment from its incidents instead: the most common value of Chicago's block field, upper-cased because the same block appears in two spellings:
busy = SEG.nlargest(8, "incidents").index
name = j[j.index_right.isin(busy)].groupby("index_right").block.agg(lambda b: b.str.upper().mode()[0])
top = SEG.loc[busy, ["incidents", "per_100ft"]].assign(length_ft=SEG.length[busy].round(0), block=name)
print(top.round(1).to_string(index=False))
print(f"block spellings that differ only in case: {j.block.nunique() - j.block.str.upper().nunique():,}")
types = j[j.index_right == busy[0]].primary_type.value_counts(normalize=True).head(3)
print(f"busiest segment's leading types: {', '.join(f'{k.lower()} {v:.0%}' for k, v in types.items())}")
incidents per_100ft length_ft block
488 238.3 205.0 0000X N STATE ST
465 100.2 464.0 001XX N STATE ST
379 41.5 913.0 011XX S CANAL ST
343 31.9 1077.0 076XX S CICERO AVE
338 7.2 4701.0 0000X W TERMINAL ST
318 18.5 1717.0 001XX W 87TH ST
303 41.4 731.0 044XX N BROADWAY
289 9.0 3202.0 057XX S CICERO AVE
block spellings that differ only in case: 1,461
busiest segment's leading types: theft 81%, battery 6%, assault 3%
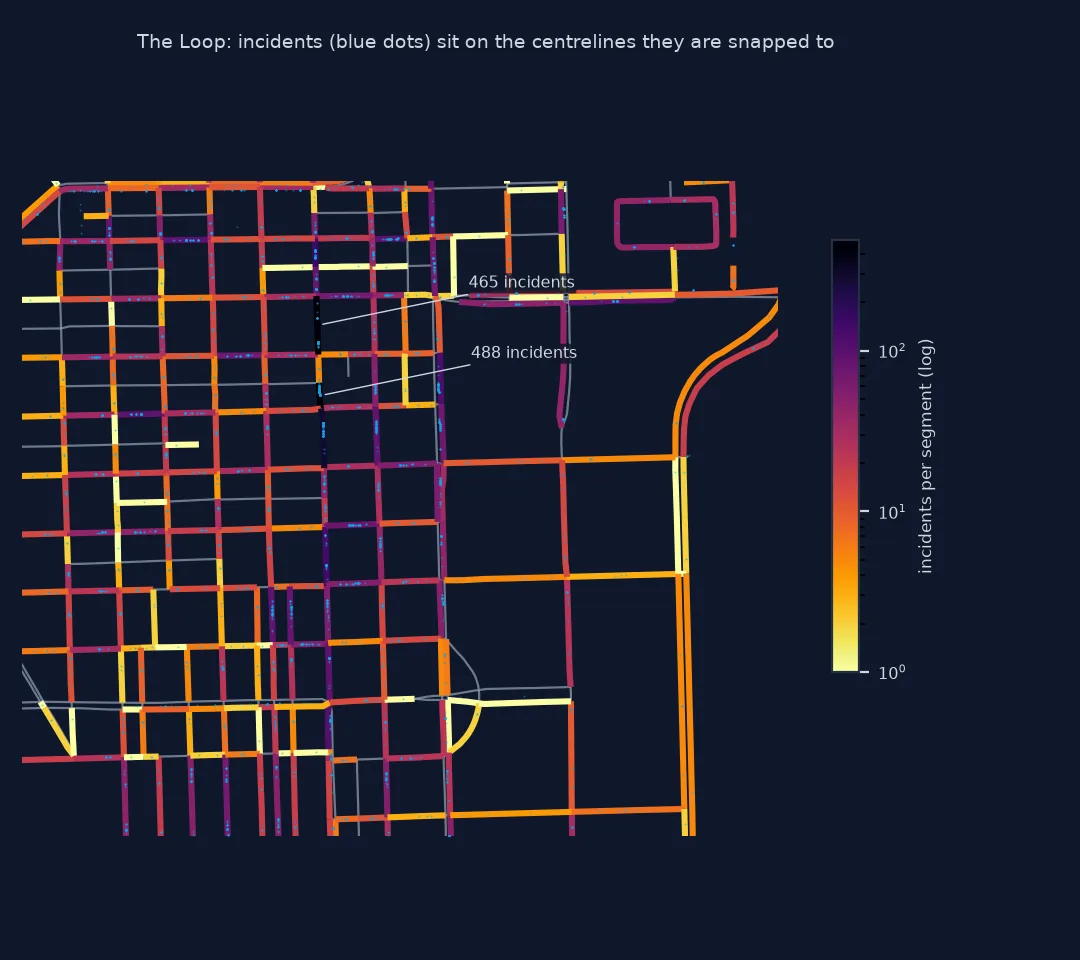
The two busiest segments are consecutive blocks of State Street in the Loop, 953 incidents between them, 81% of them thefts on the first. Others are long commercial stretches of Cicero Avenue and 87th Street, and the 4,701-foot Terminal Street at O'Hare, where the per-length density is low. 1,461 block names appear in more than one spelling, differing only in capitalisation.
The street segment as a place
A street segment is the unit at which people experience places: a block face with its shops, homes and bus stop, seen from the pavement. Studies in many cities have found that a small share of segments carries a large share of crime and that the busiest segments stay busy year after year, which is why place-based policing and prevention target segments rather than neighbourhoods. Doing the same analysis needs the segments as data, including the many with nothing recorded, because concentration is a statement about the whole set.
The construction matters. Raw network edges are split by everything that touches them, so a single block can be several edges and counts per edge are partly an artefact of the map. Merging at false nodes, where only two edges meet, gives intersection-to-intersection pieces. Snapping is easy with Chicago's data, because the police department already places incidents on street centrelines; with geocoded addresses that sit on parcels, a tolerance of a few tens of metres is normal, and points at intersections need a rule, here the first match.
Counts per segment and counts per length answer different questions. A count says where incidents happen; a density says where they happen most for the street's size. Short segments make densities noisy, so a minimum length or a combination of the two keeps the top of the list meaningful.
Intersections, expressways and network vintage
- Intersections: incidents recorded at an intersection belong to all its segments equally; assign them to one, split them, or keep intersections as their own units.
- Expressways: interstates (
S1100) are included here; drop them if crimes on them are not of interest. - Network vintage: TIGER 2023 against 2024 incidents; new streets are rare in an old city but common in growing ones.
- Block numbers: Chicago's
blockfield, such as "012XX W MADISON ST", is an alternative key; it groups both directions of a hundred-block, which is close to, but not the same as, a segment. - Speed:
sjoin_nearestwith amax_distanceuses a spatial index; a quarter of a million points take seconds.
Internal links
- How to aggregate events to road segments in Python — events on a linear network
- How to map crime hotspots with kernel density in Python — density surfaces
- How to download and map city crime data in Python — the incidents
FAQ
How do I assign crimes to street segments in Python?
Build segments from a street network, merging edges at nodes where only two meet, then use geopandas.sjoin_nearest with a max_distance and keep one match per point.
Where can I get street segments for a US city?
The Census Bureau's TIGER/Line edges, one file per county, contain every road edge; merge them at false nodes with momepy.remove_false_nodes to get intersection-to-intersection segments.
Why include street segments with no crime?
Because the share of segments that carry most crime is a statement about all segments; leaving out the empty ones overstates how evenly crime is spread.
Should I count crimes per segment or per length?
Both: counts show where incidents happen, counts per length where they happen most for the street's size; very short segments make densities unstable.