
How to Measure Urban Growth From NLCD in Python
On this page
Problem statement
How fast is a place being built over, and is it growing outwards faster than its population? The National Land Cover Database answers the first half with nine consistent maps of developed land from 2001 to 2021. Census population estimates answer the second. Put together, they give the measure the UN uses for Sustainable Development Goal 11.3.1: the ratio of the land consumption rate to the population growth rate. A ratio above 1 means land is being developed faster than people arrive.
This page measures urban growth in Williamson County, Texas, across all nine NLCD years, and sets it against the county's population.
Quick answer
Download every year, count developed pixels (classes 21–24), and convert to area:
dev = pd.Series({y: np.isin(LC[y], [21, 22, 23, 24]).sum() * PIXEL_KM2 for y in YEARS}, name="developed km²")
print(dev.round(1).to_string())
print(f"2001 to 2021: +{dev[2021] - dev[2001]:.0f} km² ({dev[2021] / dev[2001] - 1:+.0%})")
2001 331.8
2004 343.7
2006 379.3
2008 404.3
2011 422.2
2013 431.4
2016 464.2
2019 495.9
2021 523.2
2001 to 2021: +191 km² (+58%)
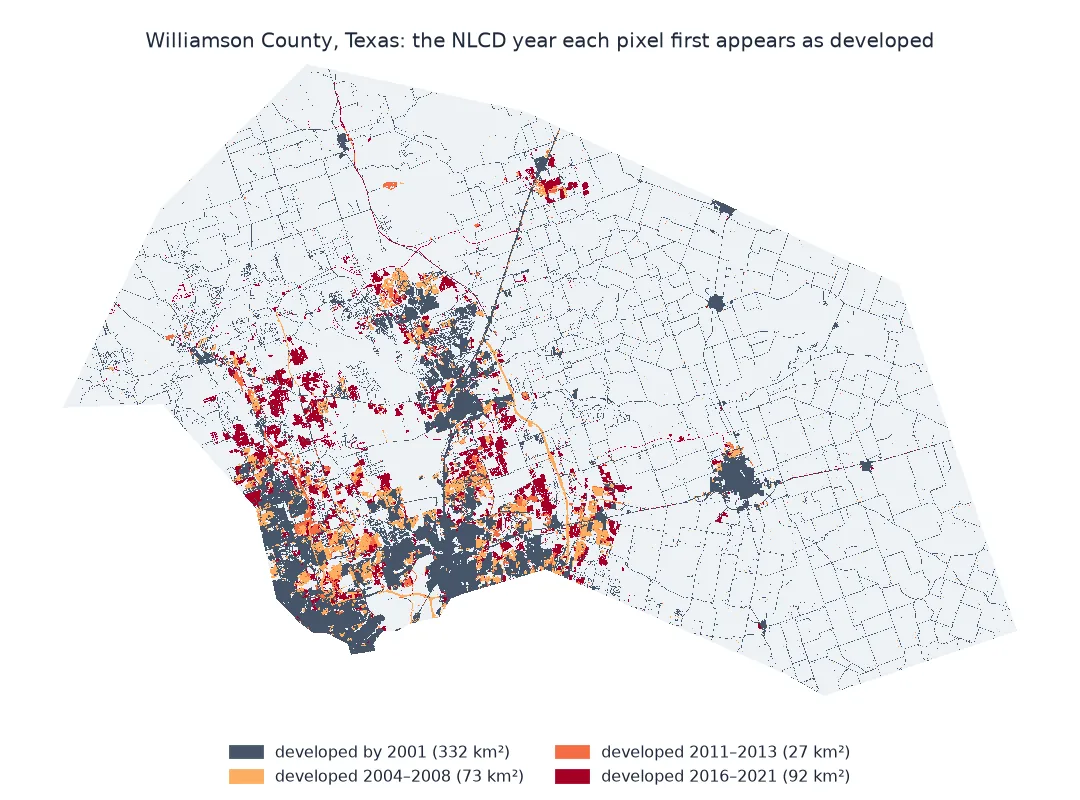
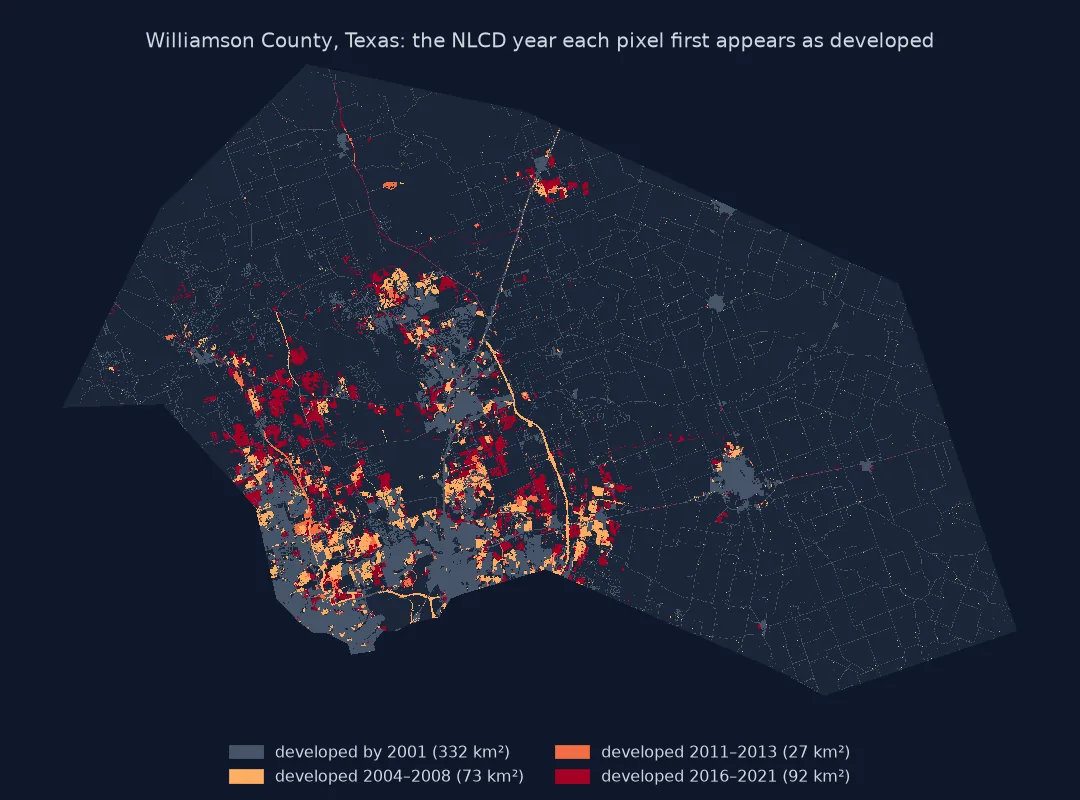
Rates not steps, land against people, SDG 11.3.1
1. Compare periods by rate, not by step
NLCD years are two or three years apart, so the change between neighbouring years must be divided by the gap:
steps = pd.DataFrame({"km²": dev.diff(), "years": pd.Series(YEARS, index=YEARS).diff()})
steps["km² per year"] = steps["km²"] / steps.years
print(steps.dropna().round(1).to_string())
km² years km² per year
2004 11.9 3.0 4.0
2006 35.5 2.0 17.8
2008 25.1 2.0 12.5
2011 17.8 3.0 5.9
2013 9.2 2.0 4.6
2016 32.8 3.0 10.9
2019 31.7 3.0 10.6
2021 27.3 2.0 13.7
The pace varied by a factor of four: 17.8 km² a year from 2006 to 2008, against 4.0 to 5.9 in 2001–2004 and 2011–2013. A plain difference between neighbouring years would exaggerate the three-year steps.
2. Set land against people
Developed land per resident shows whether new residents arrive at higher or lower density than the existing ones:
both = pd.DataFrame({"developed km²": dev, "population": POP.reindex(YEARS)})
both["m² per person"] = both["developed km²"] * 1e6 / both.population
print(both.round(0).astype(int).to_string())
developed km² population m² per person
2001 332 276940 1198
2004 344 316532 1086
2006 379 351970 1078
2008 404 395437 1023
2011 422 442366 954
2013 431 470494 917
2016 464 528207 879
2019 496 591823 838
2021 523 644595 812
Developed land per resident fell from 1,198 m² to 812 m²: the county grew more by filling in and building denser than by spreading out.
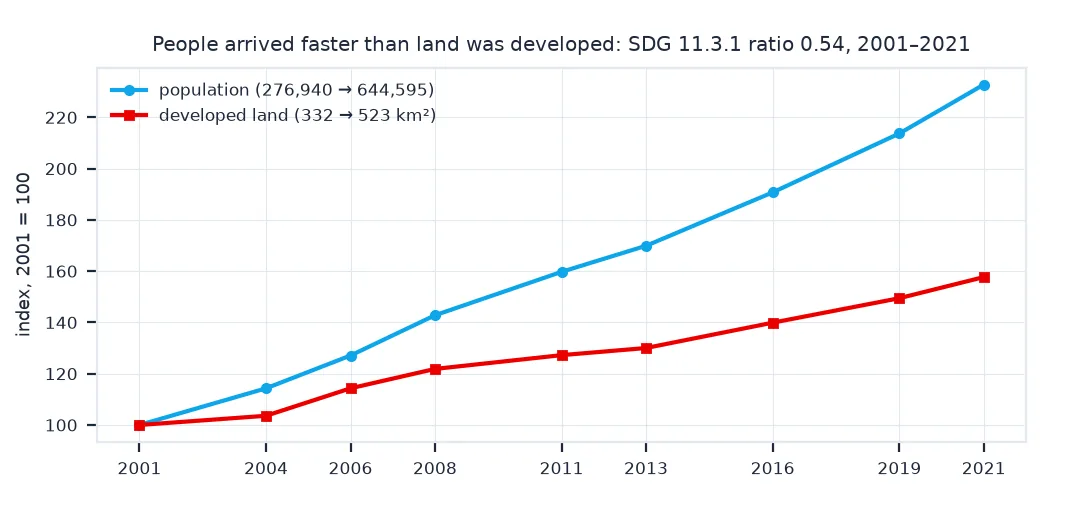
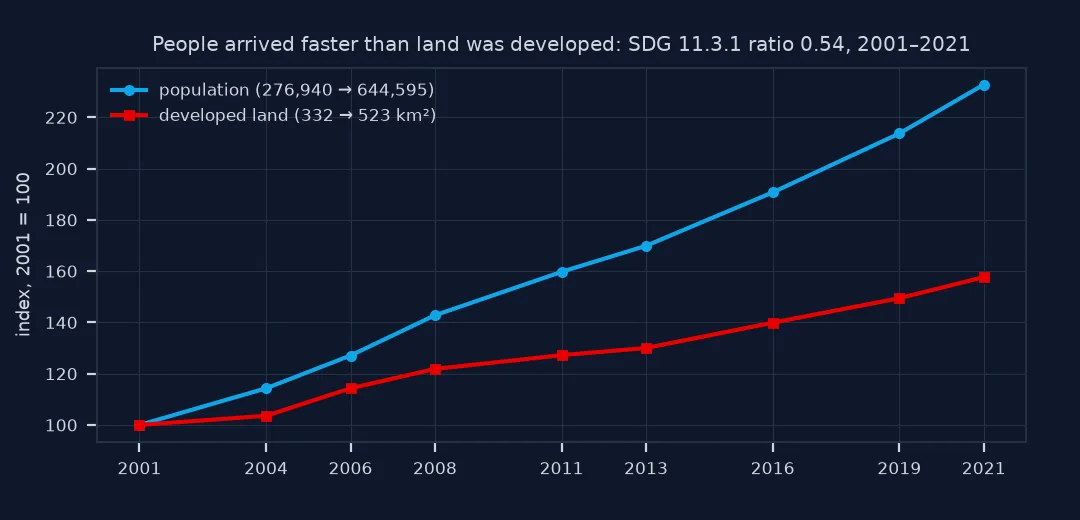
3. Compute SDG 11.3.1
The land consumption rate (LCR) and population growth rate (PGR) are both annual log growth rates. Their ratio compares them:
def sdg_1131(t0, t1):
    n = t1 - t0
    lcr = np.log(dev[t1] / dev[t0]) / n
    pgr = np.log(POP[t1] / POP[t0]) / n
    return lcr, pgr, lcr / pgr

for t0, t1 in ((2001, 2011), (2011, 2021), (2001, 2021)):
    lcr, pgr, ratio = sdg_1131(t0, t1)
    print(f"{t0}–{t1}: land consumption {lcr:.2%}/yr, population growth {pgr:.2%}/yr, ratio {ratio:.2f}")
2001–2011: land consumption 2.41%/yr, population growth 4.68%/yr, ratio 0.51
2011–2021: land consumption 2.15%/yr, population growth 3.76%/yr, ratio 0.57
2001–2021: land consumption 2.28%/yr, population growth 4.22%/yr, ratio 0.54
A ratio below 1 means the county added people faster than developed land, so density within the developed area rose.
Which kind of development grew
The data used on this page
NLCD land cover for all nine years of the 2021 release (2001–2021, 30 m) for Williamson County, Texas, from MRLC's WCS; county population estimates for 1 July of each year from the Census Bureau's 2000–2010 intercensal, 2010–2020 and vintage 2023 county estimates.
import io
import time
from pathlib import Path

import geopandas as gpd
import numpy as np
import pandas as pd
import rasterio
import rasterio.mask
import requests

Path("data").mkdir(exist_ok=True)
WCS = "https://www.mrlc.gov/geoserver/mrlc_download/wcs"
if not Path("data/cb_2023_us_county_20m.zip").exists():
    Path("data/cb_2023_us_county_20m.zip").write_bytes(requests.get("https://www2.census.gov/geo/tiger/GENZ2023/shp/cb_2023_us_county_20m.zip", timeout=300).content)
COUNTY = gpd.read_file("data/cb_2023_us_county_20m.zip").query("GEOID == '48491'").to_crs(5070)
YEARS = [2001, 2004, 2006, 2008, 2011, 2013, 2016, 2019, 2021]
PIXEL_KM2 = 30 * 30 / 1e6


def nlcd(year):
    path = Path(f"data/nlcd_{year}.tif")
    if not path.exists():
        x0, y0, x1, y1 = COUNTY.total_bounds
        for attempt in range(4):
            r = requests.get(WCS, params={"service": "WCS", "version": "2.0.1", "request": "GetCoverage",
                                          "coverageId": f"mrlc_download__NLCD_{year}_Land_Cover_L48",
                                          "subset": [f"X({x0},{x1})", f"Y({y0},{y1})"], "format": "image/geotiff"}, timeout=300)
            if r.status_code < 500:
                break
            time.sleep(15 * (attempt + 1))
        r.raise_for_status()
        path.write_bytes(r.content)
    with rasterio.open(path) as src:
        return rasterio.mask.mask(src, COUNTY.geometry, crop=True, nodata=0)[0][0]


LC = {y: nlcd(y) for y in YEARS}
EST = "https://www2.census.gov/programs-surveys/popest/datasets/"
pop = {}
for url, years in ((EST + "2000-2010/intercensal/county/co-est00int-tot.csv", range(2000, 2010)),
                   (EST + "2010-2020/counties/totals/co-est2020-alldata.csv", range(2010, 2021)),
                   (EST + "2020-2023/counties/totals/co-est2023-alldata.csv", range(2021, 2024))):
    f = Path("data", url.rsplit("/", 1)[1])
    if not f.exists():
        f.write_bytes(requests.get(url, timeout=300).content)
    t = pd.read_csv(f, encoding="latin-1", dtype={"STATE": str, "COUNTY": str})
    row = t[(t.STATE == "48") & (t.COUNTY == "491")].iloc[0]
    pop.update({y: int(row[f"POPESTIMATE{y}"]) for y in years})
POP = pd.Series(pop)
print(f"{len(LC)} NLCD years; population {POP[2001]:,} in 2001, {POP[2021]:,} in 2021")
9 NLCD years; population 276,940 in 2001, 644,595 in 2021
Example 1: which kind of development grew
inten = pd.DataFrame({y: {c: (LC[y] == c).sum() * PIXEL_KM2 for c in (21, 22, 23, 24)} for y in (2001, 2011, 2021)}).T
inten.columns = ["open space", "low", "medium", "high"]
print(inten.round(1).to_string())
print("growth 2001–2021:", (inten.loc[2021] / inten.loc[2001] - 1).map("{:+.0%}".format).to_dict())
open space low medium high
2001 155.1 86.5 68.3 21.9
2011 167.5 108.9 110.6 35.2
2021 170.3 134.8 165.2 53.0
growth 2001–2021: {'open space': '+10%', 'low': '+56%', 'medium': '+142%', 'high': '+142%'}
Medium- and high-intensity development grew by 142% each, open space by 10%. Growth here was mostly the denser kinds of development.
NLCD is built for exactly this
NLCD is built for exactly this. Its nine years come from one consistent process that detects change and relabels only changed pixels, so the developed area in one year is directly comparable with the next. Developed land in NLCD is defined by impervious cover, in four intensity classes from open space (lawns, parks, golf courses, under 20% impervious) to high intensity (over 80%). Counting classes 21–24 counts everything built.
The SDG 11.3.1 ratio turns two growth curves into one number. Above 1, development outpaces population and each resident accounts for more developed land over time, typical of low-density suburban growth. Below 1, the population is densifying the developed area. The ratio says nothing about where growth happens or what it replaced; for that, use a change matrix and a map of where each pixel was first developed.
Survey years, open space and log ratios
- Mid-year and survey years: population estimates are for 1 July; NLCD years refer to the imagery's growing season. The mismatch is a few months.
- Developed never reverts in NLCD, so the developed series cannot fall; it measures cumulative development.
- Open space (class 21) includes rural roads and large lawns; some studies exclude it from "urban".
- County boundaries cut metro areas; for a city's growth use an urban area or a commuting zone.
- Logs, not percentages: SDG 11.3.1 uses log growth rates, so periods of different lengths compare fairly.
Internal links
- How to build a land cover change matrix — what the new development replaced
- How to download NLCD land cover — the data
FAQ
How do I measure urban growth with NLCD?
Count pixels in the developed classes (21–24) for each NLCD year, multiply by 900 m², and compare years as rates per year.
What is SDG indicator 11.3.1?
The ratio of the land consumption rate to the population growth rate, both computed as annual log growth over the same period.
What does an SDG 11.3.1 ratio below 1 mean?
Population grew faster than developed land, so the developed area became denser.
Which NLCD years can I compare?
All nine years of one release (2001, 2004, 2006, 2008, 2011, 2013, 2016, 2019 and 2021 in the 2021 release) are designed to be compared.