
How to Measure Impervious Surface by Watershed in Python
On this page
Problem statement
Roofs, roads and parking lots shed rain instead of soaking it up, and the share of a watershed they cover is one of the best single predictors of stream health. The Impervious Cover Model used in stormwater planning puts streams in watersheds above about 10% impervious cover at risk of degradation, and above about 25% as typically non-supporting of healthy aquatic life. NLCD publishes impervious cover for every 30 m pixel in the contiguous US as a percentage from 0 to 100, for the same nine years as its land cover.
Computing a watershed's impervious share is a zonal mean, with one trap: the NLCD impervious files declare 0 as their nodata value, and 0% is also the most common real value. This page computes impervious cover for the HUC-12 subwatersheds of Williamson County, Texas, in 2001 and 2021, and shows what the trap does.
Quick answer
Rasterise the watersheds onto the impervious grid, then average the percentages per watershed. Read the raster without letting the declared nodata hide the zeros:
zones = features.rasterize([(g, k + 1) for k, g in enumerate(HUC.geometry)], out_shape=IMP[2021].shape, transform=TRANSFORM)
def zonal_mean(arr):
    s = np.bincount(zones.ravel(), weights=arr.ravel().astype(float), minlength=len(HUC) + 1)
    n = np.bincount(zones.ravel(), minlength=len(HUC) + 1)
    return s[1:] / n[1:]

HUC["imp_2001"], HUC["imp_2021"] = zonal_mean(IMP[2001]), zonal_mean(IMP[2021])
print(f"{len(HUC)} subwatersheds; impervious cover 2021: median {HUC.imp_2021.median():.1f}%, max {HUC.imp_2021.max():.1f}% ({HUC.loc[HUC.imp_2021.idxmax(), 'name']})")
27 subwatersheds; impervious cover 2021: median 1.5%, max 34.1% (Lake Creek-Brushy Creek)
Keep zeros from nodata, convert to area, classify by thresholds
1. Do not let nodata swallow the zeros
The file says its nodata value is 0. A masked read, or any tool that honours the nodata value, drops every 0% pixel, which is most of the countryside:
with rasterio.open("data/imp_2021.tif") as src:
    print(f"declared nodata: {src.nodata}; share of pixels at 0%: {(src.read(1) == 0).mean():.0%}")
    masked = src.read(1, masked=True)
print(f"mean impervious cover of the whole box: {IMP[2021].mean():.2f}% read as values, {masked.mean():.2f}% with 0 treated as nodata")
declared nodata: 0.0; share of pixels at 0%: 85%
mean impervious cover of the whole box: 5.99% read as values, 39.35% with 0 treated as nodata
Outside the US the files have no pixels at all, so there is no real nodata to protect within a US watershed. Read the values as they are (or set nodata=None when opening) and mask with your own polygons instead.
2. Convert percentages to area
A pixel at 40% holds 360 m² of impervious surface. Summing percentage × pixel area gives the impervious area:
for y in (2001, 2021):
    km2 = IMP[y][zones > 0].sum() / 100 * 900 / 1e6
    print(f"{y}: {km2:,.1f} km² impervious in the {len(HUC)} subwatersheds ({km2 / (np.count_nonzero(zones) * 900 / 1e6):.1%} of their area)")
2001: 103.3 km² impervious in the 27 subwatersheds (3.2% of their area)
2021: 215.0 km² impervious in the 27 subwatersheds (6.8% of their area)
3. Classify against the thresholds
bands = [-1, 10, 25, 101]
labels = ["< 10% (sensitive)", "10–25% (impacted)", "> 25% (non-supporting)"]
t = pd.DataFrame({y: pd.cut(HUC[f"imp_{y}"], bands, labels=labels).value_counts().reindex(labels) for y in (2001, 2021)})
print(t.to_string())
2001 2021
< 10% (sensitive) 23 20
10–25% (impacted) 4 4
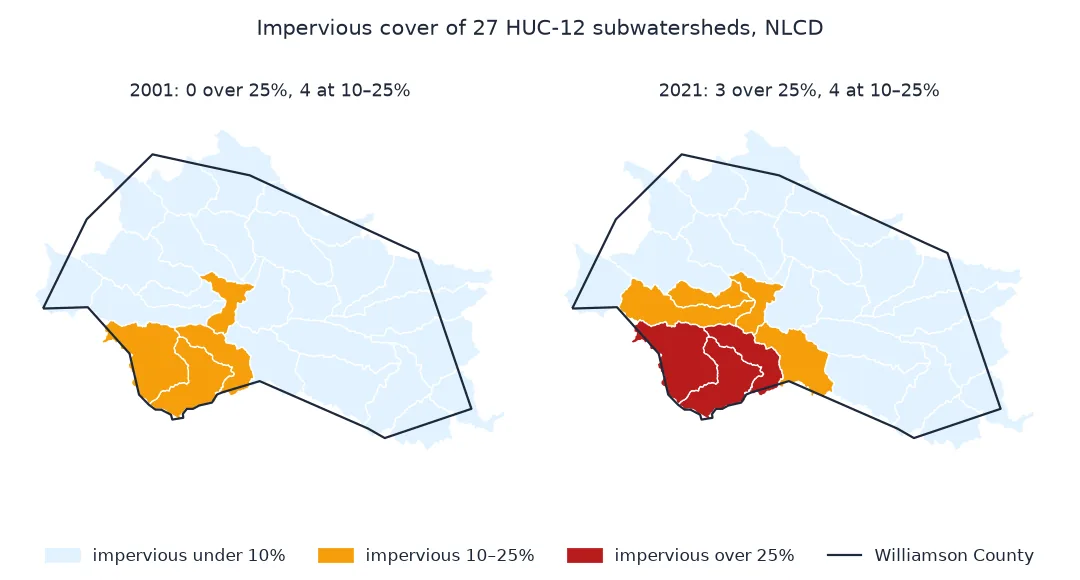
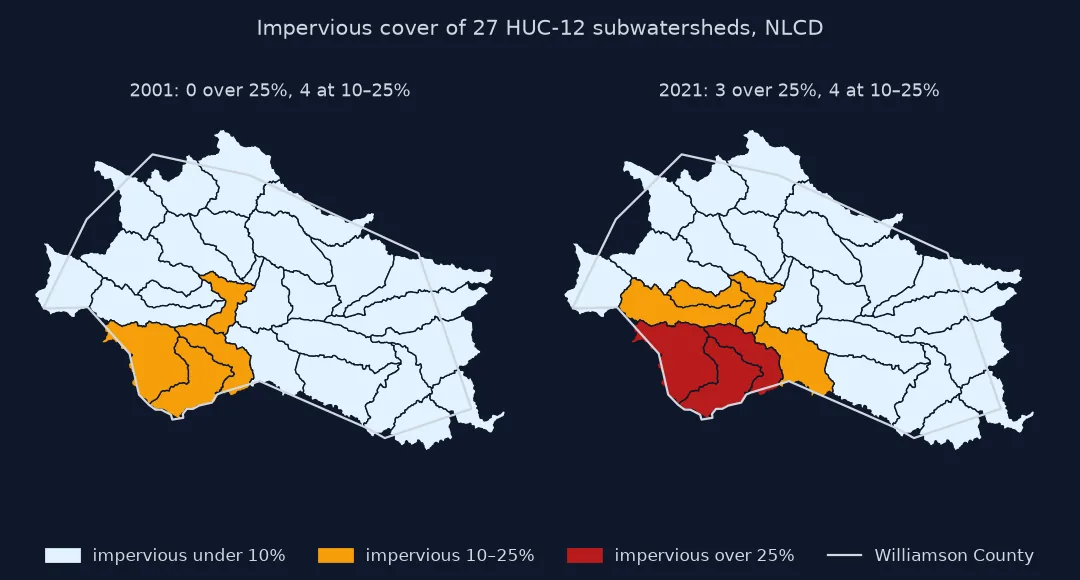
> 25% (non-supporting) 0 3
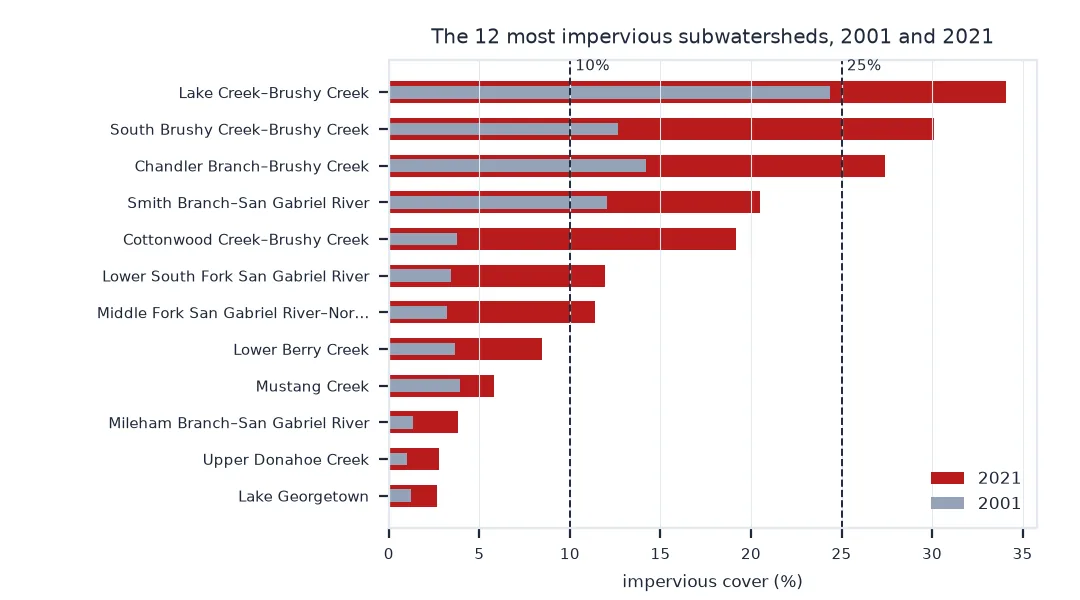
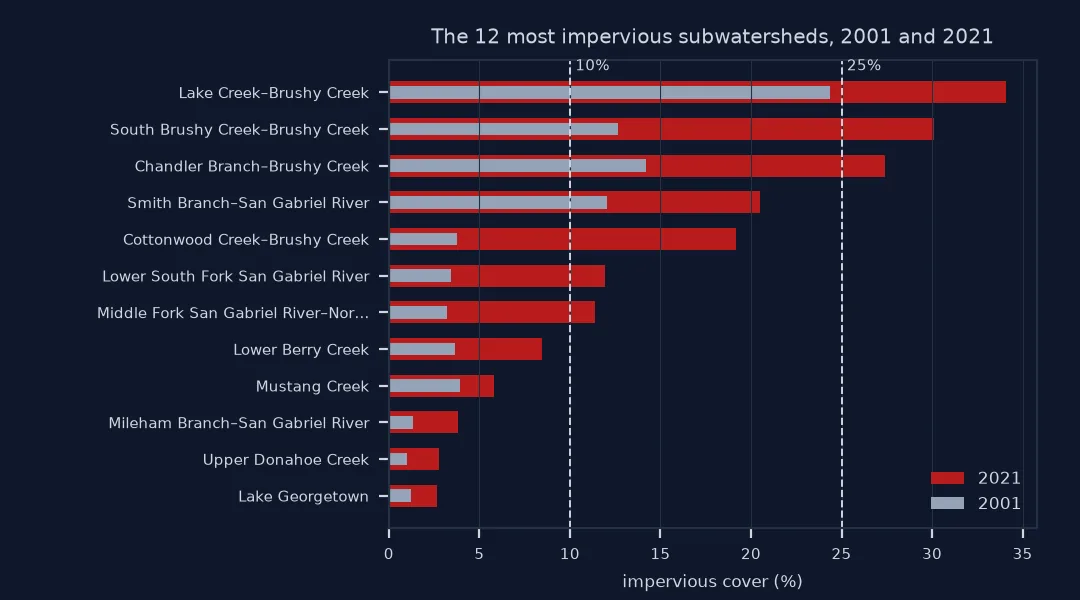
In 2001 no subwatershed was above 25%; by 2021 three were, and Example 1 below shows they all drain to Brushy Creek, through Round Rock and Cedar Park. Impervious area across the 27 subwatersheds roughly doubled, from 103 to 215 km².
Subwatersheds that crossed a threshold
The data used on this page
NLCD impervious surface for 2001 and 2021 (2021 release, 30 m, percent) from MRLC's WCS, and HUC-12 subwatersheds from the USGS Watershed Boundary Dataset map service, selected where their centroid falls in Williamson County, Texas, all in CONUS Albers (EPSG:5070).
import time
from pathlib import Path

import geopandas as gpd
import numpy as np
import pandas as pd
import rasterio
import requests
from rasterio import features

Path("data").mkdir(exist_ok=True)
WCS = "https://www.mrlc.gov/geoserver/mrlc_download/wcs"
if not Path("data/cb_2023_us_county_20m.zip").exists():
    Path("data/cb_2023_us_county_20m.zip").write_bytes(requests.get("https://www2.census.gov/geo/tiger/GENZ2023/shp/cb_2023_us_county_20m.zip", timeout=300).content)
COUNTY = gpd.read_file("data/cb_2023_us_county_20m.zip").query("GEOID == '48491'").to_crs(5070)
lon0, lat0, lon1, lat1 = COUNTY.to_crs(4326).total_bounds
wbd = gpd.read_file(requests.get("https://hydro.nationalmap.gov/arcgis/rest/services/wbd/MapServer/6/query",
                                 params={"geometry": f"{lon0},{lat0},{lon1},{lat1}", "geometryType": "esriGeometryEnvelope", "inSR": 4326,
                                         "spatialRel": "esriSpatialRelIntersects", "outFields": "huc12,name", "outSR": 4326, "f": "geojson"},
                                 timeout=300).text).to_crs(5070)
HUC = wbd[wbd.representative_point().within(COUNTY.union_all())].reset_index(drop=True)
x0, y0, x1, y1 = HUC.total_bounds
IMP = {}
for year in (2001, 2021):
    path = Path(f"data/imp_{year}.tif")
    if not path.exists():
        for attempt in range(4):
            r = requests.get(WCS, params={"service": "WCS", "version": "2.0.1", "request": "GetCoverage",
                                          "coverageId": f"mrlc_download__NLCD_{year}_Impervious_L48",
                                          "subset": [f"X({x0},{x1})", f"Y({y0},{y1})"], "format": "image/geotiff"}, timeout=300)
            if r.status_code < 500:
                break
            time.sleep(15 * (attempt + 1))
        r.raise_for_status()
        path.write_bytes(r.content)
    with rasterio.open(path) as src:
        IMP[year] = src.read(1)
        TRANSFORM = src.transform
print(f"{len(HUC)} HUC-12 subwatersheds centred in the county, {HUC.area.sum() / 1e6:,.0f} km²; grid {IMP[2021].shape}")
27 HUC-12 subwatersheds centred in the county, 3,182 km²; grid (2137, 3129)
Example 1: the subwatersheds that crossed a threshold
crossed = HUC[(pd.cut(HUC.imp_2001, bands) != pd.cut(HUC.imp_2021, bands))]
print(crossed.assign(change=crossed.imp_2021 - crossed.imp_2001)[["name", "imp_2001", "imp_2021", "change"]]
      .sort_values("change", ascending=False).round(1).to_string(index=False))
name imp_2001 imp_2021 change
South Brushy Creek-Brushy Creek 12.6 30.1 17.4
Cottonwood Creek-Brushy Creek 3.8 19.2 15.4
Chandler Branch-Brushy Creek 14.2 27.4 13.2
Lake Creek-Brushy Creek 24.4 34.1 9.7
Lower South Fork San Gabriel River 3.4 11.9 8.5
Middle Fork San Gabriel River-North Fork San Gabriel River 3.2 11.4 8.2
Impervious cover links land to water
Impervious cover links land development to water. Rain on a roof or road runs off quickly, carrying heat and pollutants, instead of soaking into soil and reaching the stream slowly as groundwater. The Impervious Cover Model generalises dozens of studies into a few thresholds at the scale of small watersheds, which is why HUC-12 subwatersheds, typically tens to a few hundred square kilometres, are the usual unit.
NLCD estimates impervious cover per pixel from Landsat imagery and other inputs, so a pixel's value is a fraction of its 900 m², not a yes or no. That makes means and sums meaningful, but only if every pixel is counted. The nodata convention is the catch: 0 means "no impervious surface" inside the US, and treating it as missing turns a watershed's mean into the mean of its developed pixels only.
Zonal tools, partial pixels and guide thresholds
- Zonal tools honour nodata:
rasterstats,exactextractandxarraymasking all drop declared nodata by default; override it for this product. - Partial pixels: rasterising assigns each pixel to one watershed by its centre; for small watersheds, an area-weighted tool such as
exactextractis more exact. - Descriptor layer: NLCD's impervious descriptor says what kind of surface (roads, buildings, energy) each pixel is.
- Years: impervious cover comes for the same nine years as NLCD land cover; compare within one release.
- Thresholds are guides: the 10% and 25% thresholds are central values of a gradual decline, not sharp limits.
Internal links
- How to measure urban growth from NLCD — developed land in the same county
- How to calculate zonal statistics in Python — zonal statistics in general
FAQ
How do I calculate impervious surface percentage for a watershed?
Download NLCD impervious for the watershed's extent, average the pixel percentages inside it (counting 0% pixels), and report the mean.
Why is my NLCD impervious mean too high?
The files declare 0 as nodata, so tools that honour nodata drop all 0% pixels. Read the values directly or override the nodata value.
What impervious cover harms streams?
The Impervious Cover Model associates more than about 10% impervious cover in a small watershed with stream degradation, and more than about 25% with streams that no longer support healthy aquatic life.
Where can I get watershed boundaries?
The USGS Watershed Boundary Dataset, as downloads or through its ArcGIS map service; HUC-12 subwatersheds are layer 6.