
How to Map Storm-Total Rainfall in Python
On this page
Problem statement
After a hurricane or a flood the first question is how much rain fell, where — a storm-total map — and the second is how much fell on each county, catchment or city, for damage assessment, insurance and the record books. Both look straightforward with a rainfall grid, and both have traps: which accumulation product covers the whole storm, how to add up shorter totals without double counting, and how to average a latitude–longitude grid over polygons so that the cells are weighted by their real area.
This page builds the storm total for Hurricane Beryl in Texas (7–10 July 2024) from NOAA's MRMS grids, checks it two ways, and computes area-weighted totals for every county in its path.
Quick answer
Use the 72-hour multi-sensor product ending after the rain stopped, or sum consecutive 24-hour products; then average over each county with cell-area weights:
total = mrms("MultiSensor_QPE_72H_Pass2", "20240710-120000").sel(latitude=slice(33.6, 27.6), longitude=slice(-98.5, -92.0))
cell_km2 = (111.32 * 0.01) ** 2 * np.cos(np.radians(total.latitude.values))[:, None] * np.ones(total.shape)
rows = []
for _, county in COUNTIES.iterrows():
    inside = features.rasterize([(county.geometry, 1)], out_shape=total.shape, transform=TRANSFORM, dtype="uint8").astype(bool)
    v, w = total.values[inside], cell_km2[inside]
    ok = np.isfinite(v)
    rows.append({"county": county.NAME, "mean_mm": np.average(v[ok], weights=w[ok]), "max_mm": float(v[ok].max()), "km2": float(w.sum())})
by_county = pd.DataFrame(rows).sort_values("mean_mm", ascending=False)
print(by_county.head(6).round(1).to_string(index=False))
county mean_mm max_mm km2
Brazoria 182.1 248.1 3788.6
Harris 162.1 253.7 4603.0
Gregg 159.2 198.2 730.7
Fort Bend 158.3 215.0 2295.6
Galveston 148.2 255.5 1075.4
Rusk 147.5 237.8 2478.3
A window that holds the storm, a consistency check, area weights
1. Choose a window that holds the whole storm
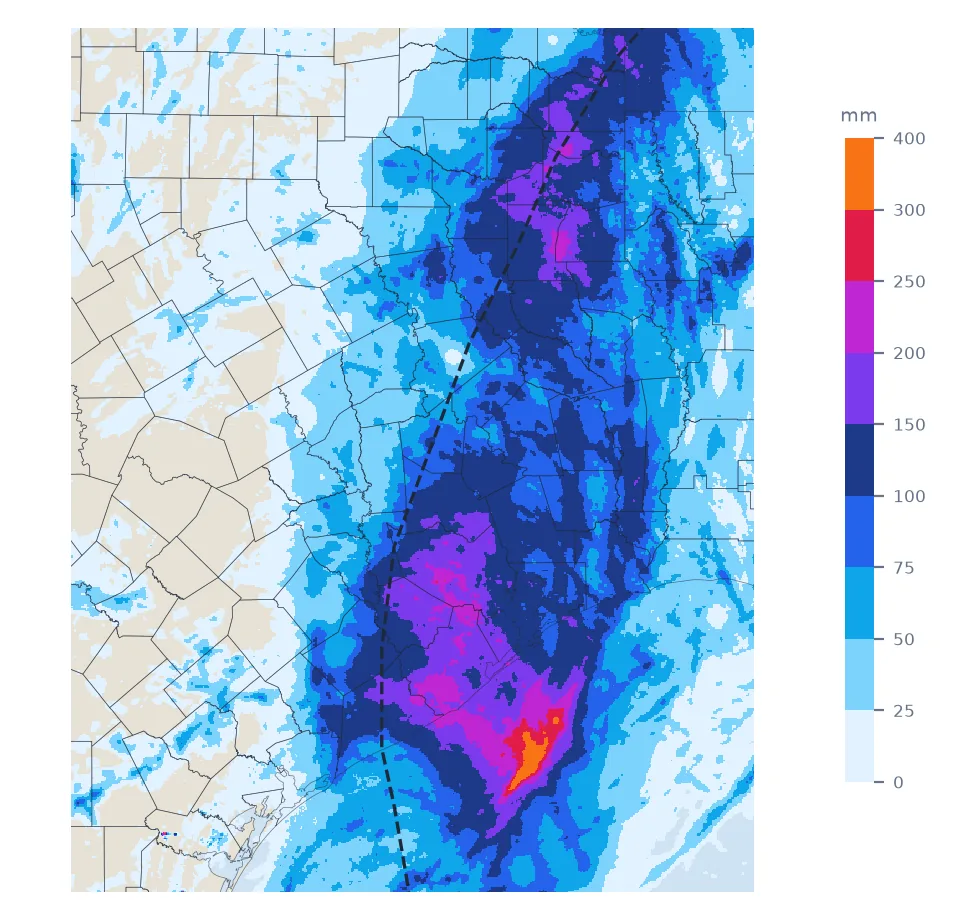
Beryl's rain reached south-east Texas early on 8 July and had left the state by early 10 July. The MRMS 72-hour total ending 12 UTC on 10 July covers 12 UTC 7 July to 12 UTC 10 July — the whole event with a margin either side:
top = total.where(total == total.max(), drop=True)
print(f"72 h ending 12 UTC 10 July: max {float(total.max()):.0f} mm at {float(top.latitude[0]):.2f} N, "
      f"{float(top.longitude[0]):.2f} E; land and sea cells over 250 mm: {int((total >= 250).sum()):,}")
72 h ending 12 UTC 10 July: max 398 mm at 28.43 N, -94.87 E; land and sea cells over 250 mm: 1,339
2. Check it against the sum of shorter windows
Three consecutive 24-hour totals should add up to the 72-hour one:
parts = [mrms("MultiSensor_QPE_24H_Pass2", s).sel(latitude=slice(33.6, 27.6), longitude=slice(-98.5, -92.0))
         for s in ("20240708-120000", "20240709-120000", "20240710-120000")]
summed = sum(parts)
print(f"72 h minus sum of three 24 h: largest difference {float(abs(total - summed).max()):.5f} mm")
72 h minus sum of three 24 h: largest difference 0.00003 mm
They agree to rounding. Summing windows that overlap — two 24-hour totals ending 00 and 12 UTC, say — would double-count the twelve hours they share.
3. Weight cells by area
On a latitude–longitude grid, cells shrink towards the poles. Across east Texas a 0.01° cell is a few per cent smaller at the north edge than the south — small here, decisive over a continent — and a mean over a polygon should weight each cell by its area. The quick answer does that with cell_km2.
4. Rasterise counties onto the grid
rasterio.features.rasterize burns each county into a mask on the MRMS grid using the grid's affine transform, so every cell is assigned to the county containing its centre:
print(f"{len(COUNTIES)} counties with at least 10 cells; pixel {TRANSFORM.a:.2f} deg, origin {TRANSFORM.c:.3f}, {TRANSFORM.f:.3f}")
print(by_county[by_county.county.isin(["Harris", "Galveston", "Brazoria", "Matagorda"])].round(1).to_string(index=False))
131 counties with at least 10 cells; pixel 0.01 deg, origin -98.500, 33.600
county mean_mm max_mm km2
Brazoria 182.1 248.1 3788.6
Harris 162.1 253.7 4603.0
Galveston 148.2 255.5 1075.4
Matagorda 128.5 224.4 3585.0
5. Report with the window and the product
A county's storm total is meaningful only with its definition: "MRMS MultiSensor QPE Pass2, 72 hours ending 12 UTC 10 July 2024, area-weighted county mean". The maximum in a county is a single 1 km cell and should be quoted as such.
What area weighting changes
The data used on this page
NOAA MRMS MultiSensor QPE Pass2, 72-hour and 24-hour accumulations, from the NOAA MRMS archive on AWS; county boundaries from the US Census Bureau cartographic boundary files, 2023, 1:500,000.
import gzip
import shutil
from pathlib import Path

import geopandas as gpd
import numpy as np
import pandas as pd
import requests
import xarray as xr
from affine import Affine
from rasterio import features

Path("data").mkdir(exist_ok=True)

def mrms(product, stamp):
    name = f"MRMS_{product}_00.00_{stamp}.grib2"
    if not Path("data", name).exists():
        url = f"https://noaa-mrms-pds.s3.amazonaws.com/CONUS/{product}_00.00/{stamp[:8]}/{name}.gz"
        Path("data", name + ".gz").write_bytes(requests.get(url, timeout=300).content)
        with gzip.open(Path("data", name + ".gz")) as f, open(Path("data", name), "wb") as o:
            shutil.copyfileobj(f, o)
    q = xr.open_dataset(Path("data", name), engine="cfgrib", decode_timedelta=True, backend_kwargs={"indexpath": ""})["unknown"]
    q = q.where(q >= 0)
    return q.assign_coords(longitude=q.longitude - 360)

CB = "https://www2.census.gov/geo/tiger/GENZ2023/shp/cb_2023_us_county_500k.zip"
if not Path("data/counties.zip").exists():
    Path("data/counties.zip").write_bytes(requests.get(CB, timeout=300).content)
counties = gpd.read_file("data/counties.zip")
COUNTIES = counties[counties.STATEFP == "48"].to_crs(4326).cx[-98.5:-92.0, 27.6:33.6]
grid = mrms("MultiSensor_QPE_72H_Pass2", "20240710-120000").sel(latitude=slice(33.6, 27.6), longitude=slice(-98.5, -92.0))
TRANSFORM = Affine(0.01, 0, float(grid.longitude[0]) - 0.005, 0, -0.01, float(grid.latitude[0]) + 0.005)
sizes = [features.rasterize([(g, 1)], out_shape=grid.shape, transform=TRANSFORM, dtype="uint8").sum() for g in COUNTIES.geometry]
COUNTIES = COUNTIES[np.array(sizes) >= 10]
print(grid.shape, len(COUNTIES), "counties")
(600, 650) 131 counties
Example 1: what the area weighting changes
unweighted = []
for _, county in COUNTIES.iterrows():
    inside = features.rasterize([(county.geometry, 1)], out_shape=total.shape, transform=TRANSFORM, dtype="uint8").astype(bool)
    unweighted.append(np.nanmean(total.values[inside]))
diff = by_county.set_index("county").mean_mm - pd.Series(unweighted, index=COUNTIES.NAME.values)
print(f"weighted minus unweighted county means: largest {diff.abs().max():.3f} mm")
weighted minus unweighted county means: largest 0.041 mm
Within one degree or two of latitude, area weighting barely matters; over a whole country it does. Doing it always costs nothing.
Example 2: area over a threshold
land = features.rasterize([(g, 1) for g in COUNTIES.geometry], out_shape=total.shape, transform=TRANSFORM, dtype="uint8").astype(bool)
for t in (100, 150, 200):
    print(f"Texas land in these counties with {t} mm or more: {cell_km2[land & (total.values >= t)].sum():,.0f} km²")
Texas land in these counties with 100 mm or more: 49,274 km²
Texas land in these counties with 150 mm or more: 14,375 km²
Texas land in these counties with 200 mm or more: 2,222 km²
Sums over time, averages over space
A storm total is a sum over time, and a county total is an average over space; both are easy to compute and easy to compute subtly wrong. In time, the danger is double counting or missing hours by stitching together windows that overlap or leave gaps. Using a single product that spans the event avoids it, and checking that product against the sum of non-overlapping shorter ones verifies it.
In space, the danger is treating a geographic grid as if its cells were equal. They are equal in degrees, not in square kilometres. Weighting by cell area — or working on an equal-area grid — keeps the average honest, and rasterising polygons onto the grid's own transform keeps every cell assigned once. With both in place, the Beryl totals tell a coherent story: the heaviest rain fell offshore and along the coast south of Houston, and Brazoria, Harris and Fort Bend counties averaged more than 150 mm.
Overlapping windows and grid rasterising
- Pick a window that spans the storm; MRMS offers 1, 3, 6, 12, 24, 48 and 72 hours.
- Never sum overlapping windows.
- Weight by cell area on latitude–longitude grids.
- Rasterise on the grid's own transform; resampling the grid instead blurs totals.
- Quote maxima as single cells, not as county values.
- Coastal counties include sea cells only if the polygon does; cartographic boundaries are clipped to the shoreline.
Internal links
- How to read MRMS rainfall from GRIB2 — the grids
- How to map a hurricane track from IBTrACS — Beryl's path
- Rainfall return periods explained — how rare these totals were
- Rainfall accumulation has gaps — missing hours
- How to compare radar and gauge rainfall — checking the grid
FAQ
How do I make a storm-total rainfall map?
Use a multi-hour accumulation product that spans the event (MRMS 72-hour MultiSensor QPE for US storms), or sum non-overlapping shorter totals, and plot it with a classed colour scale.
How do I calculate average rainfall per county in Python?
Rasterise each county onto the rainfall grid with rasterio.features.rasterize using the grid's transform, and take an area-weighted mean of the cells inside.
How much rain did Hurricane Beryl drop on Houston?
In MRMS MultiSensor QPE Pass2 for the 72 hours ending 12 UTC on 10 July 2024, Harris County averaged about 160 mm, with single cells over 250 mm.
Can I add 24-hour rainfall totals together?
Only if they do not overlap: three 24-hour totals ending 12 UTC on consecutive days equalled the 72-hour total to rounding.