
How to Map Homicides and Shootings in Python
On this page
Problem statement
Homicides and shootings are the crimes most often mapped and the ones where counting goes wrong most easily. One incident can have several victims, so a table of incidents and a table of victims give different totals for the same year. Two official datasets can disagree because they define the offence differently or date it differently. And homicide is rare enough that a single year's rate for a small neighbourhood moves a long way on one or two deaths.
This page uses Chicago's victim-level dataset of homicides and non-fatal shootings for 2022–2024, reconciles its 2024 homicides with the main crimes dataset case by case, computes homicide rates per 100,000 residents by community area over one year and over three, and maps the share of shooting victims who died.
Quick answer
Count victims, not rows of incidents, and say which: in the victims dataset each row is one person harmed in one event:
V24 = V[V.year == 2024]
print(f"2024: {V24.homicide.sum()} homicide victims ({V24[V24.homicide].shot.mean():.0%} shot), "
      f"{(~V24.homicide & V24.shot).sum():,} non-fatal shooting victims")
print(f"homicide victims per case: {V24[V24.homicide].groupby('case_number').size().value_counts().sort_index().to_dict()}")
print(f"cases: {V24[V24.homicide].case_number.nunique()}; victims: {V24.homicide.sum()}")
2024: 589 homicide victims (88% shot), 2,333 non-fatal shooting victims
homicide victims per case: {1: 535, 2: 21, 3: 4}
cases: 560; victims: 589
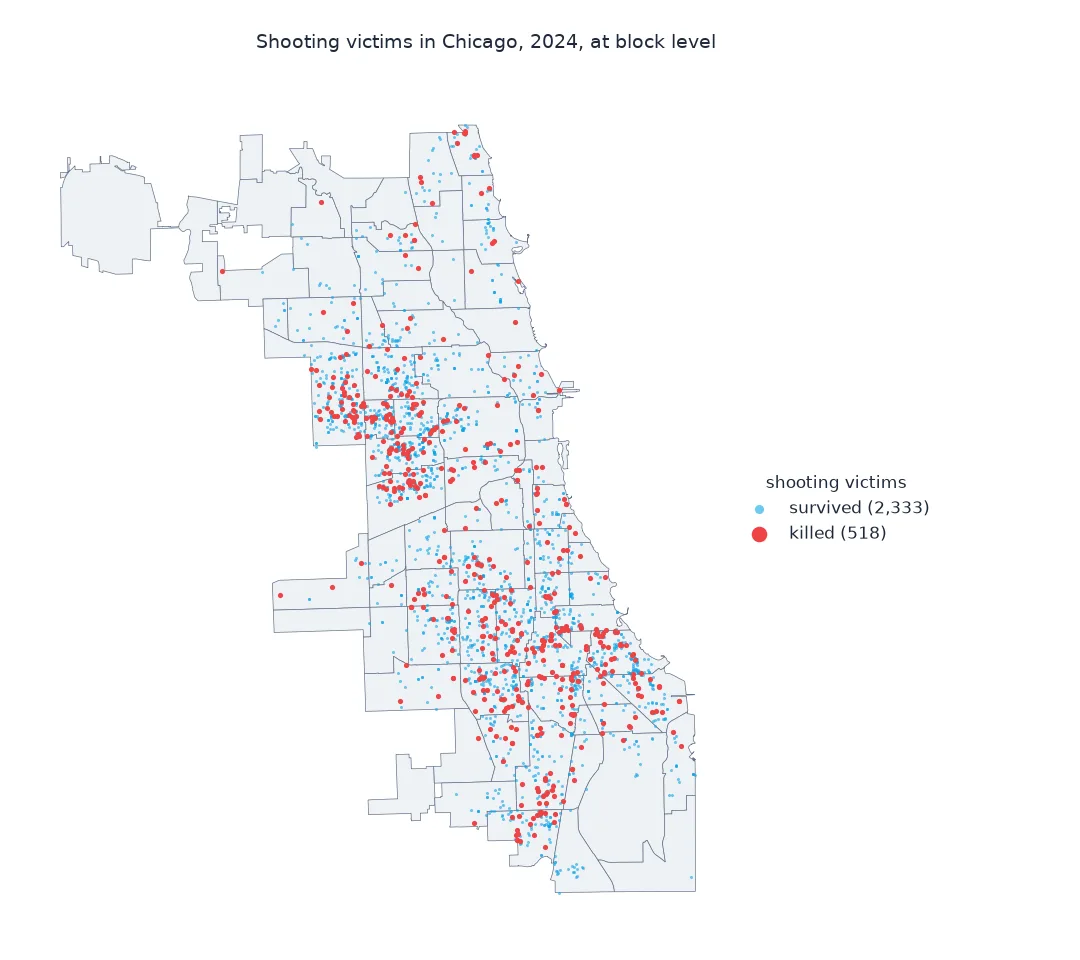
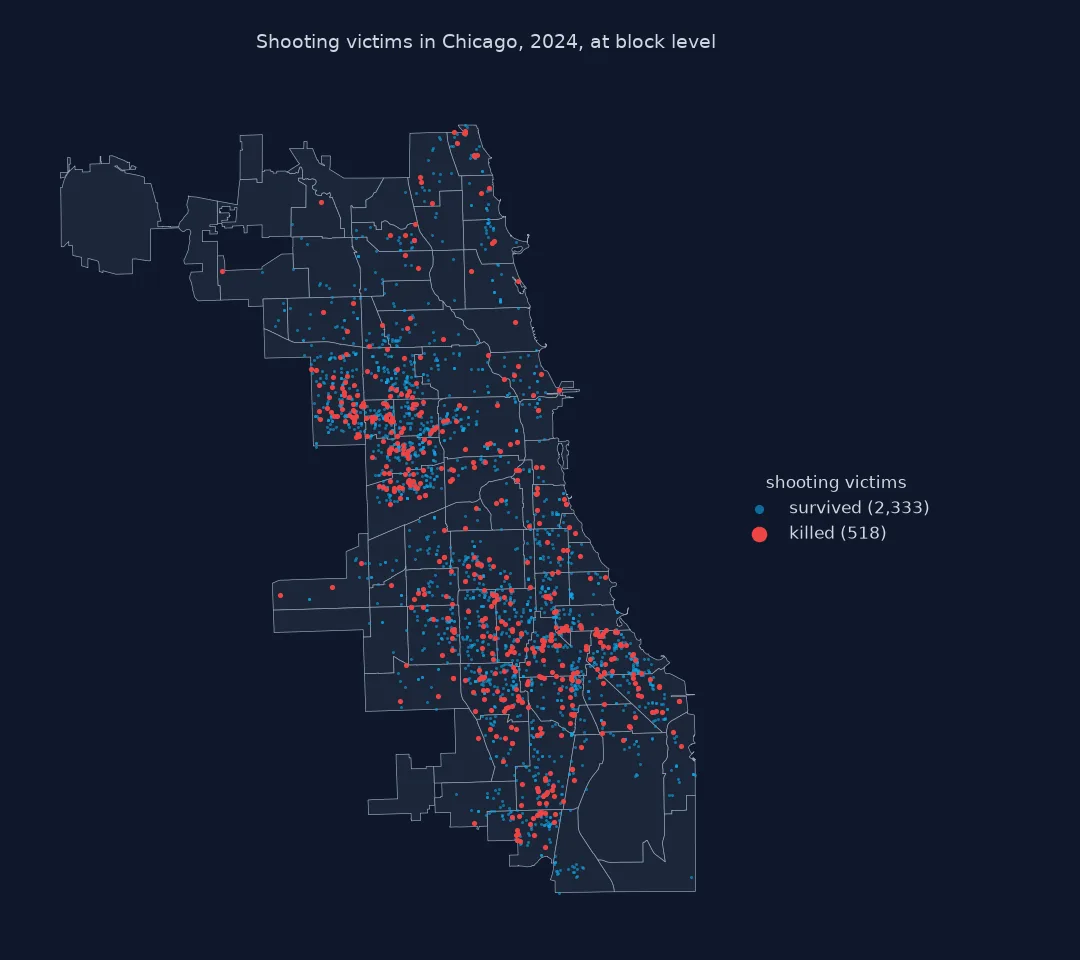
The 589 homicide victims of 2024 come from 560 cases: 21 cases had two victims and four had three. 88% of the victims were shot, and for every homicide victim about four more people survived a shooting.
Reconcile two datasets, rates over one and three years
1. Reconcile two datasets
The main crimes dataset also has homicides. Matching the two by case number shows what each counts:
both = set(CRIMES_HOM.case_number) & set(V24[V24.homicide].case_number)
only_crimes = CRIMES_HOM[~CRIMES_HOM.case_number.isin(V24[V24.homicide].case_number)]
print(f"crimes dataset: {len(CRIMES_HOM)} rows, {CRIMES_HOM.case_number.nunique()} cases; victims dataset: {V24[V24.homicide].case_number.nunique()} cases; in both: {len(both)}")
print("cases only in the crimes dataset, by description:", only_crimes.drop_duplicates("case_number").description.value_counts().to_dict())
elsewhere = V[V.case_number.isin(only_crimes.case_number) & V.homicide]
print(f"of those, in the victims dataset under another year: {elsewhere.case_number.nunique()} "
      f"({', '.join(sorted(elsewhere.year.astype(str).unique()))})")
crimes dataset: 597 rows, 568 cases; victims dataset: 560 cases; in both: 556
cases only in the crimes dataset, by description: {'FIRST DEGREE MURDER': 8, 'RECKLESS HOMICIDE': 4}
of those, in the victims dataset under another year: 4 (2022, 2023)
The crimes dataset has one row per victim too, 597 rows for 568 cases. 556 cases are in both. Of the 12 cases only in the crimes dataset, four are reckless homicides, which the victims dataset leaves out; four more are murders the victims dataset dates to 2022 or 2023, consistent with a death in 2024 from an earlier attack; the last four are not in the 2022–2024 download at all.
2. Rates per 100,000, over one year and three
Homicide rates are conventionally per 100,000 residents per year. For small areas a single year is unstable; pooling three years and dividing by three gives an annual average:
H = V[V.homicide].groupby(["community_area", "year"]).size().unstack(fill_value=0).reindex(POP.index, fill_value=0)
rate_1 = H[2024] / POP * 1e5
rate_3 = H.sum(axis=1) / 3 / POP * 1e5
print(f"city: {H[2024].sum() / POP.sum() * 1e5:.1f} per 100,000 in 2024; {H.values.sum() / 3 / POP.sum() * 1e5:.1f} a year over 2022-2024")
print(f"areas with no homicide in 2024: {(H[2024] == 0).sum()}; in all three years: {(H.sum(axis=1) == 0).sum()}")
print(pd.DataFrame({"homicides 2022-24": H.sum(axis=1), "residents": POP, "rate 2024": rate_1.round(1),
                    "rate 2022-24": rate_3.round(1)}).sort_values("rate 2022-24", ascending=False).head(5).to_string())
city: 22.2 per 100,000 in 2024; 24.3 a year over 2022-2024
areas with no homicide in 2024: 15; in all three years: 4
homicides 2022-24 residents rate 2024 rate 2022-24
community_area
WEST GARFIELD PARK 75 16345.0 110.1 153.0
FULLER PARK 9 2186.0 91.5 137.2
WEST ENGLEWOOD 81 25971.0 65.5 104.0
GREATER GRAND CROSSING 89 29052.0 123.9 102.1
EAST GARFIELD PARK 60 19855.0 85.6 100.7
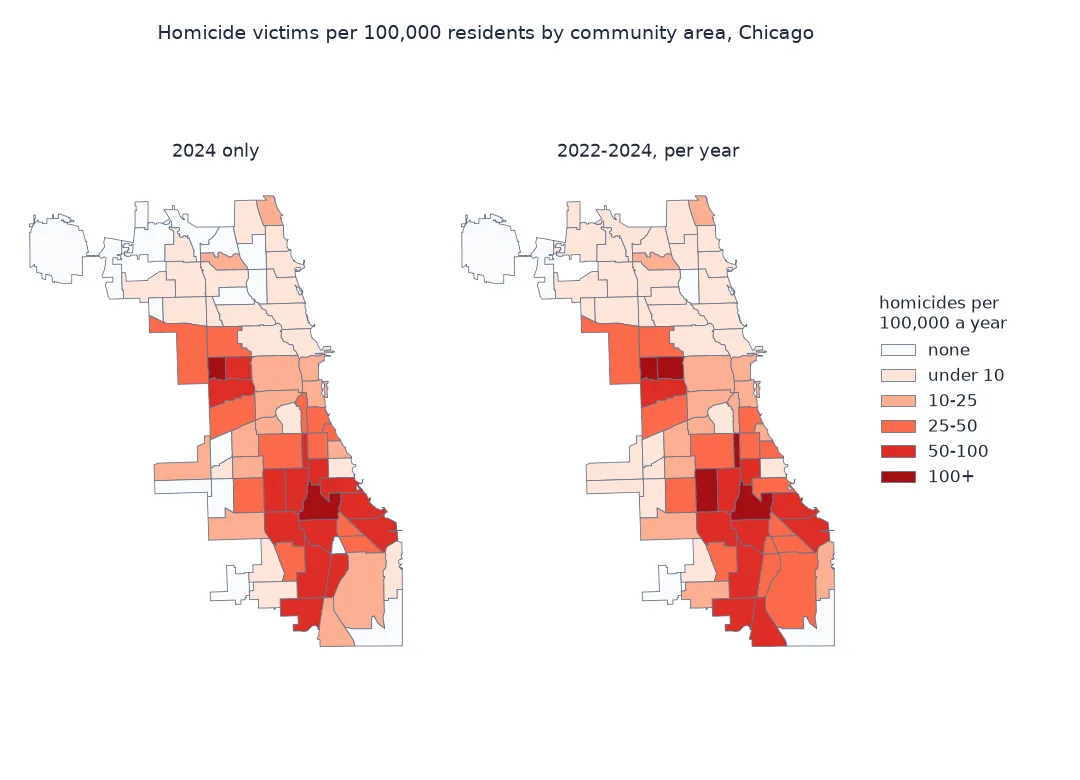
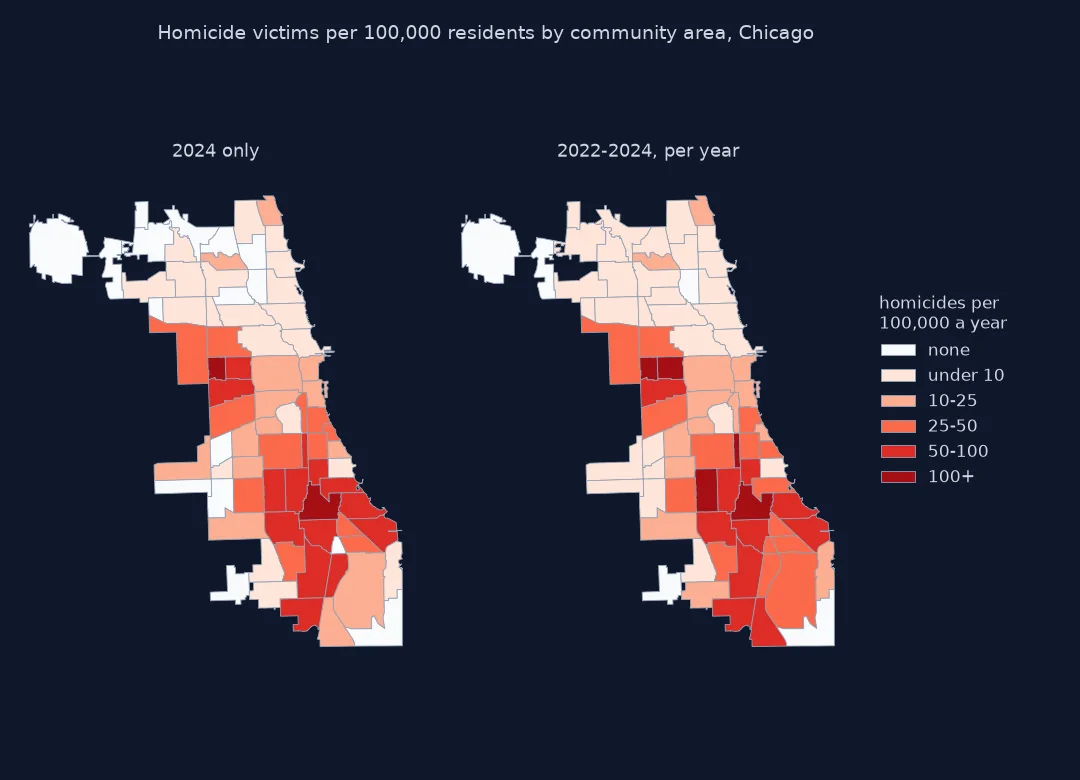
The city's rate was 22.2 per 100,000 in 2024. Fifteen of the 77 areas had no homicide that year, and four had none in three years. The pooled ranking differs from the single year: Greater Grand Crossing leads 2024 at 123.9 but is fourth over three years; Fuller Park is second over three years on nine homicides.
3. Check how stable a single year is
Compare each year's ranking with the next:
for a, b in ((2022, 2023), (2023, 2024)):
    rho = (H[a] / POP).corr(H[b] / POP, method="spearman")
    print(f"rank correlation of area rates, {a} vs {b}: {rho:.2f}")
fp = H.loc["FULLER PARK"]
print(f"Fuller Park, {POP['FULLER PARK']:,.0f} residents: {fp[2022]}, {fp[2023]}, {fp[2024]} homicides; "
      f"rate {fp[2022] / POP['FULLER PARK'] * 1e5:.0f}, {fp[2023] / POP['FULLER PARK'] * 1e5:.0f}, {fp[2024] / POP['FULLER PARK'] * 1e5:.0f}")
rank correlation of area rates, 2022 vs 2023: 0.78
rank correlation of area rates, 2023 vs 2024: 0.81
Fuller Park, 2,186 residents: 5, 2, 2 homicides; rate 229, 91, 91
Year-to-year rank correlations of 0.78 and 0.81 mean the broad pattern holds, but individual places move. Fuller Park's rate went from 229 to 91 per 100,000 on a change from five homicides to two.
How often a shooting is fatal
The data used on this page
The City of Chicago's Violence Reduction - Victims of Homicides and Non-Fatal Shootings (gumc-mgzr), one row per victimization, for 2022–2024; homicides dated 2024 from Crimes - 2001 to Present (ijzp-q8t2); the city's ACS 5 Year Data by Community Area for 2019–2023 populations; and the community area boundaries.
from pathlib import Path

import geopandas as gpd
import numpy as np
import pandas as pd
import requests

Path("data").mkdir(exist_ok=True)
PORTAL = "https://data.cityofchicago.org/resource/"


def socrata(name, dataset, **params):
    f = Path(f"data/{name}.parquet")
    if not f.exists():
        pd.DataFrame(requests.get(PORTAL + dataset + ".json", params={"$limit": 50_000, **params}, timeout=300).json()).to_parquet(f)
    return pd.read_parquet(f)


V = socrata("victims_2022_2024", "gumc-mgzr", **{
    "$where": "date >= '2022-01-01' AND date < '2025-01-01'",
    "$select": "case_number, date, victimization_primary, gunshot_injury_i, community_area, age, sex, latitude, longitude"})
V["year"] = pd.to_datetime(V.date).dt.year
V["homicide"] = V.victimization_primary == "HOMICIDE"
V["shot"] = V.gunshot_injury_i == "YES"
CRIMES_HOM = socrata("crimes_homicide_2024", "ijzp-q8t2", **{
    "$where": "year = 2024 AND primary_type = 'HOMICIDE'", "$select": "case_number, date, description"})
POP = socrata("acs_community_areas_2023", "t68z-cikk", acs_year="2023").set_index("community_area").total_population.astype(float)
G = Path("data/chicago_community_areas.geojson")
if not G.exists():
    G.write_bytes(requests.get(PORTAL + "igwz-8jzy.geojson?$limit=100", timeout=120).content)
CA = gpd.read_file(G)
print(f"{len(V):,} victimizations 2022-2024; {len(CRIMES_HOM)} homicide rows in the crimes dataset for 2024")
9,583 victimizations 2022-2024; 597 homicide rows in the crimes dataset for 2024
Example 1: how often a shooting is fatal
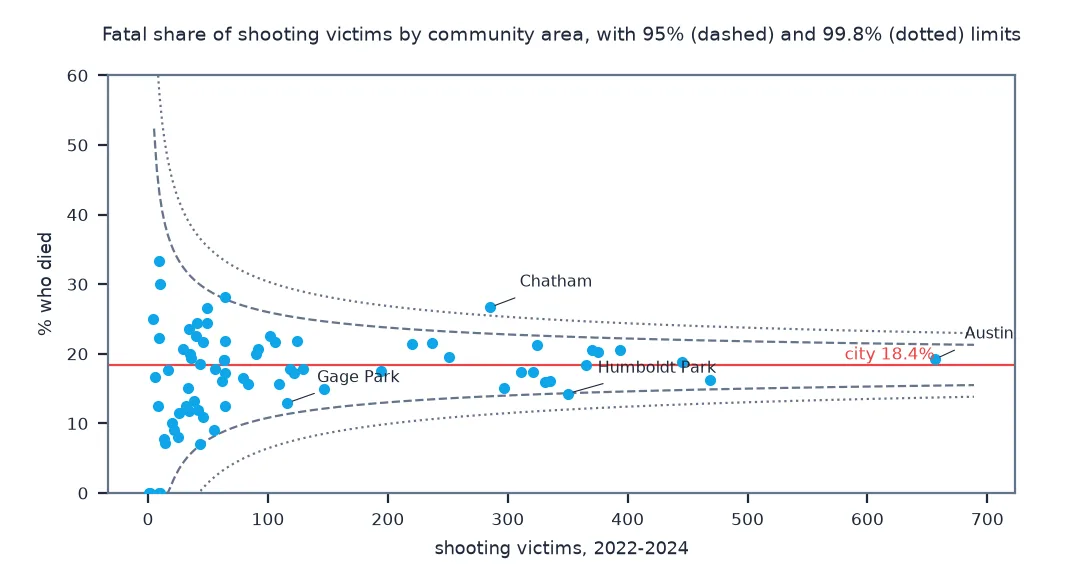
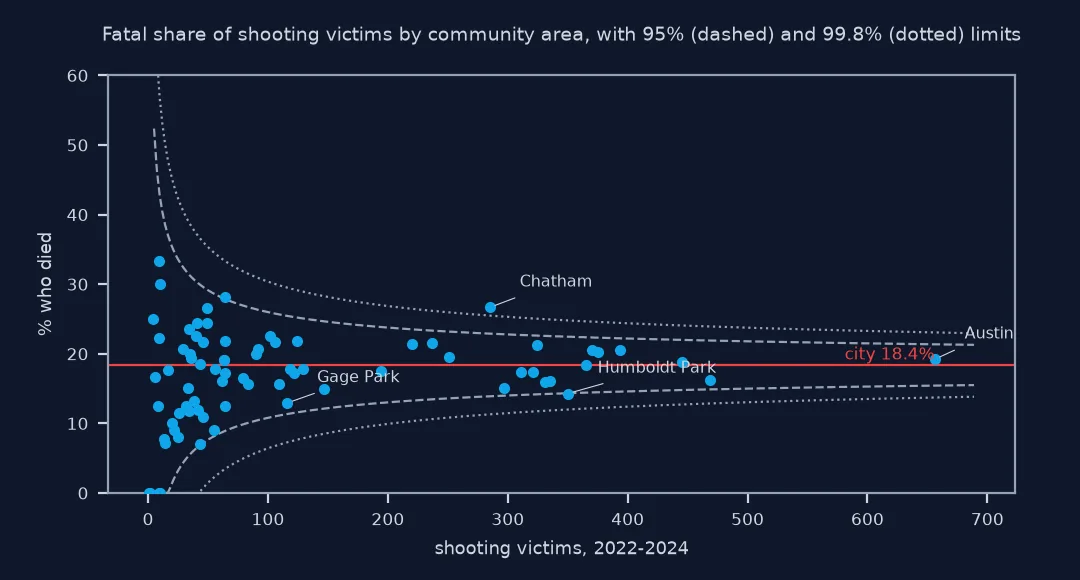
The share of shooting victims who died, by community area, for areas with at least 100 shooting victims over the three years:
S = V[V.shot].groupby("community_area").agg(victims=("homicide", "size"), died=("homicide", "sum"))
S["fatal_share"] = S.died / S.victims
p0 = S.died.sum() / S.victims.sum()
S["z"] = (S.fatal_share - p0) / np.sqrt(p0 * (1 - p0) / S.victims)       # distance from the city share, in standard errors
big = S[S.victims >= 100].sort_values("fatal_share")
print(f"city: {S.died.sum():,} of {S.victims.sum():,} shooting victims died ({S.died.sum() / S.victims.sum():.1%}); {len(big)} areas with 100+")
print(pd.concat([big.head(2), big.tail(2)]).round(3).to_string())
city: 1,725 of 9,377 shooting victims died (18.4%); 28 areas with 100+
victims died fatal_share z
community_area
GAGE PARK 116 15 0.129 -1.519
HUMBOLDT PARK 350 50 0.143 -1.985
BRIGHTON PARK 102 23 0.225 1.083
CHATHAM 285 76 0.267 3.604
18.4% of shooting victims died over the three years. Among areas with at least 100 shooting victims the share ranges from 12.9% in Gage Park to 26.7% in Chatham. Measured in standard errors from the city share, Gage Park's low figure, at 1.5, is within what chance gives for 116 victims; Humboldt Park sits right at the 95% limit, at 2.0; Chatham, at 3.6, is well beyond it.
Incident data against victim data
Violence data comes in two shapes. Incident data, like Chicago's main crimes dataset, records events; victim data records people harmed. For most offences the two are close, but shootings often wound or kill more than one person, so victim counts run higher. The city's Violence Reduction Dashboard is built from the victim data. Saying which one a map shows, and using the same one throughout, is the first step.
Two official datasets from the same police department can still disagree by a few percent. Here the differences have definite causes that a case-number join exposes: an offence included in one and not the other, and cases dated in a different year, as can happen when a victim dies long after being shot. Neither dataset is wrong; they answer slightly different questions. A reconciliation of this kind, done once and written down, prevents a lot of confused comparisons later.
Rates bring the small-numbers problem. A community area of 2,000 people with one homicide has a rate of 50 per 100,000, about twice the city average; with two it has 100. Pooling years, as here, steadies the estimate at the cost of time resolution. Statistical smoothing, such as empirical Bayes rates, is the next step when pooling is not enough.
Updates, expressways and location precision
- Updates: the victims dataset is refreshed daily and records change as cases are investigated; keep the download date.
- Expressways: shootings on expressways are investigated by the Illinois State Police and may be missing from city data.
- Location precision: victim locations are at block level, like other city crime data.
- Demographics: age is given in bands, and the dataset includes sex and race of victims; aggregate before publishing small groups.
- Non-fatal shootings before 2010: not in the public dataset; long-run shooting series start in 2010.
Internal links
- How to calculate crime rates per resident in Python — denominators and small areas
- How to analyse crime trends over time in Python — trends, seasons and types
- How to download and map city crime data in Python — the main crimes dataset
FAQ
Why do homicide counts differ between datasets?
Datasets can count victims or incidents, include or exclude offences such as reckless homicide, and date cases differently; joining on case number shows which.
How do I calculate a homicide rate per 100,000?
Divide the number of homicide victims by the population and multiply by 100,000; for small areas, pool several years and divide by the number of years.
How many homicides were there in Chicago in 2024?
The city's victims dataset recorded 589 homicide victims dated 2024, as downloaded for this page; the crimes dataset has 597 homicide rows for 2024, including four reckless homicides.
Where can I get shooting data for Chicago?
The City of Chicago's Violence Reduction victims dataset (gumc-mgzr) has homicide victims since 1991 and non-fatal shooting victims since 2010.