
How to Map Population Change Since 1975 with GHSL in Python
On this page
Problem statement
GHS-POP comes in epochs every five years from 1975 to 2030 on the same grid, so subtracting one epoch from another maps where population grew and where it fell, for any place on Earth, without assembling censuses with changing boundaries. The epochs are not all of the same kind, though: some are anchored on censuses, some are back-cast from satellite imagery of built-up areas, and the last ones are projections. Before mapping change it is worth knowing which is which, and how well each matches the record.
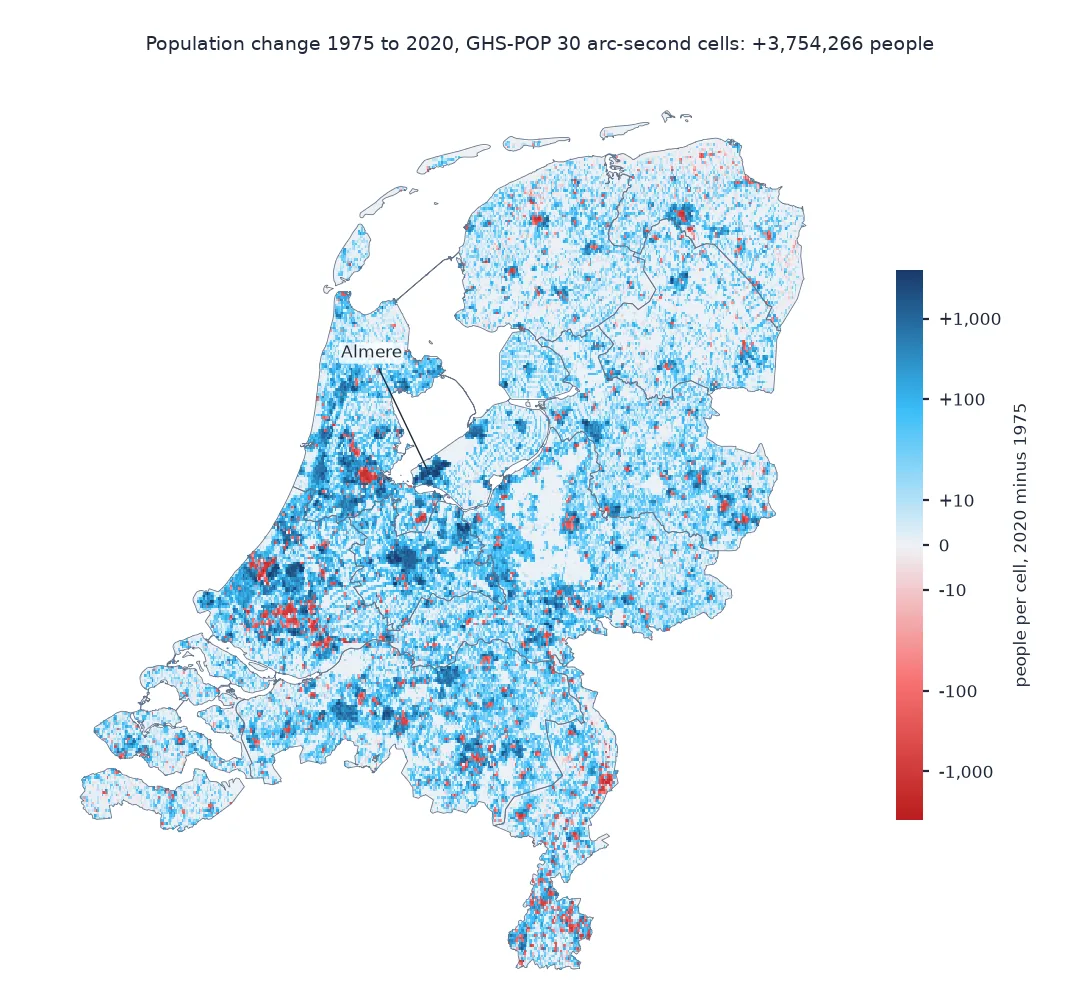
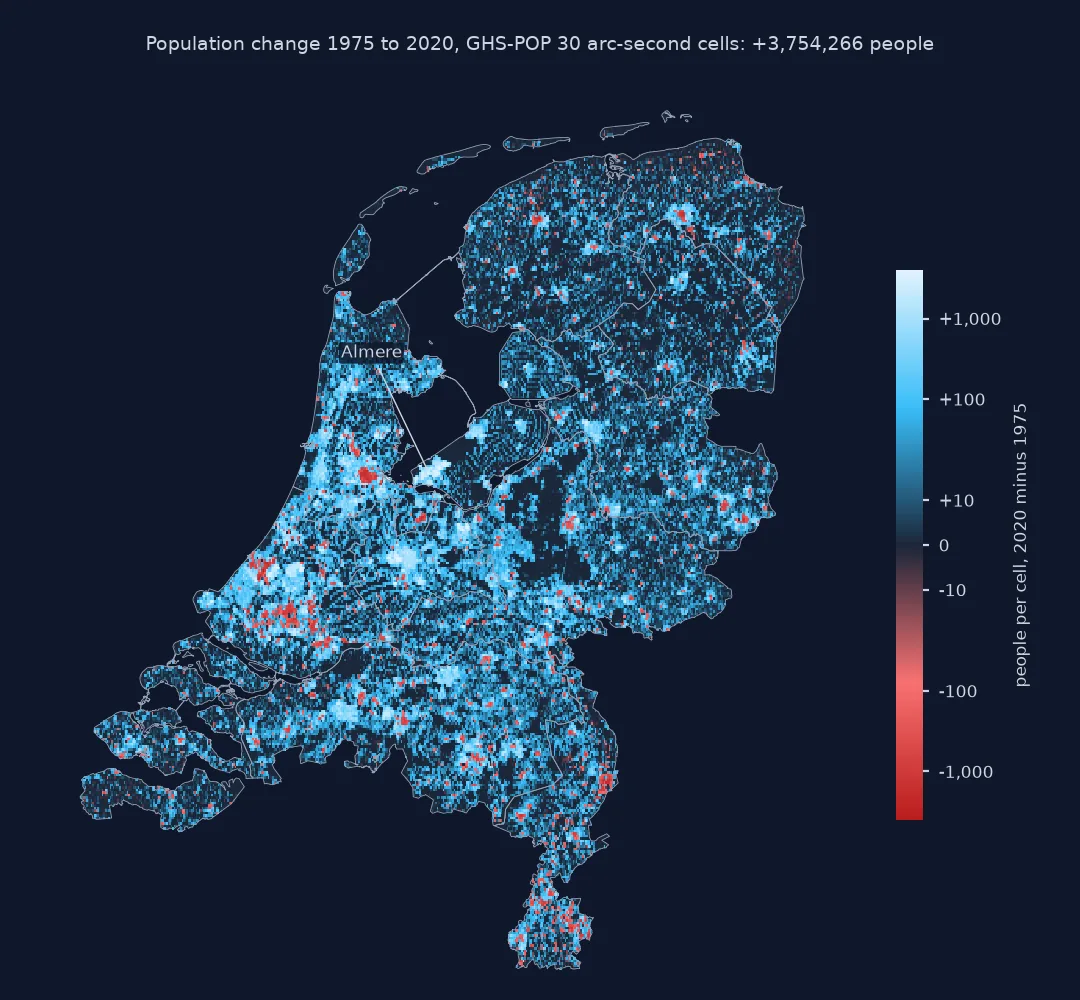
This page reads every epoch for the Netherlands, checks the national totals against Statistics Netherlands' series, maps the change from 1975 to 2020, follows the new town of Almere through the epochs, and tests the 2025 projection against the count that now exists.
Quick answer
Mask two epochs with the same boundary and subtract cell by cell; the grids are identical, so the arrays line up:
def epoch(year, area=NL):
    with rasterio.open(tile(year)) as src:
        a, transform = mask(src, area.to_crs(src.crs).geometry, crop=True, filled=False)
    return a[0], transform
p75, tf = epoch(1975)
p20, _ = epoch(2020)
change = p20 - p75
print(f"1975: {p75.sum():,.0f}; 2020: {p20.sum():,.0f}; change {change.sum():+,.0f} ({p20.sum() / p75.sum() - 1:+.1%})")
print(f"cells that grew: {(change > 0).sum():,}; fell: {(change < 0).sum():,} of {change.count():,}")
1975: 13,634,895; 2020: 17,389,161; change +3,754,266 (+27.5%)
cells that grew: 52,460; fell: 9,043 of 66,493
Between the 1975 and 2020 epochs the Netherlands gained 3,754,266 people, 27.5%. 52,460 of the 66,493 cells grew and 9,043 lost people.
Check epochs against the record, gains and losses, follow Almere
1. Check every epoch against the record
Statistics Netherlands publishes the population on 1 January for every year since 1950. Put the GHS-POP totals beside it:
rows = []
for y in YEARS:
    g = epoch(y)[0].sum()
    rows.append({"epoch": y, "ghs_pop": round(g), "cbs": CBS.get(y), "diff": g / CBS[y] - 1 if y in CBS else None})
T = pd.DataFrame(rows)
print(T.to_string(index=False, formatters={"ghs_pop": "{:,}".format, "cbs": lambda v: f"{v:,.0f}" if v == v else "-",
                                           "diff": lambda v: f"{v:+.2%}" if v == v else "-"}))
epoch ghs_pop cbs diff
1975 13,634,895 13,599,092 +0.26%
1980 14,098,072 14,091,014 +0.05%
1985 14,481,213 14,453,833 +0.19%
1990 14,908,214 14,892,574 +0.11%
1995 15,408,102 15,424,122 -0.10%
2000 15,858,331 15,863,950 -0.04%
2005 16,219,671 16,305,526 -0.53%
2010 16,573,197 16,574,989 -0.01%
2015 16,995,346 16,900,726 +0.56%
2020 17,389,161 17,407,585 -0.11%
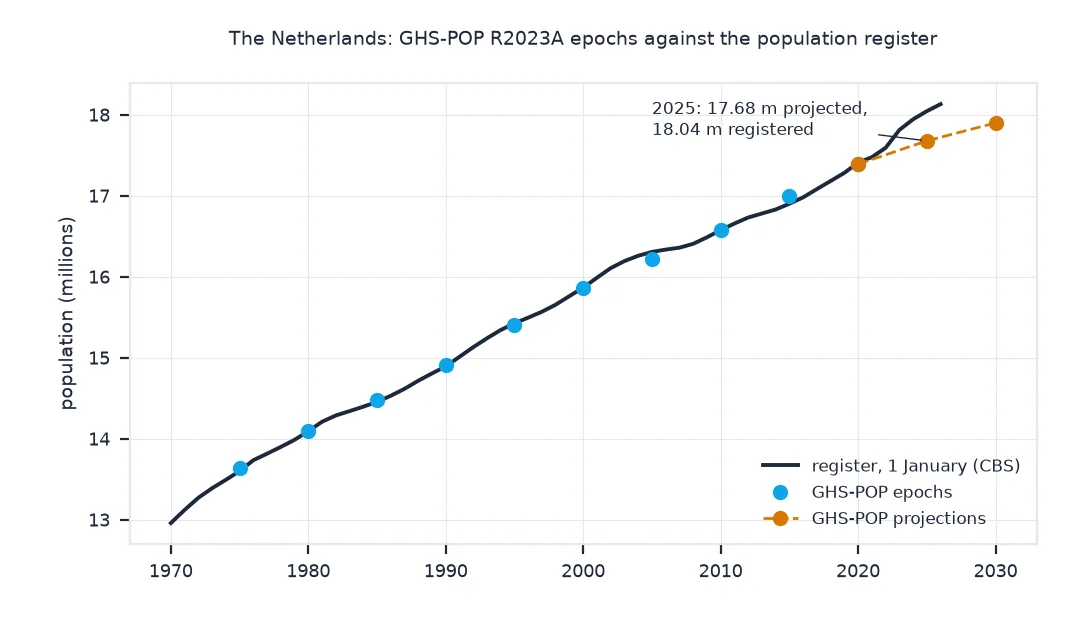
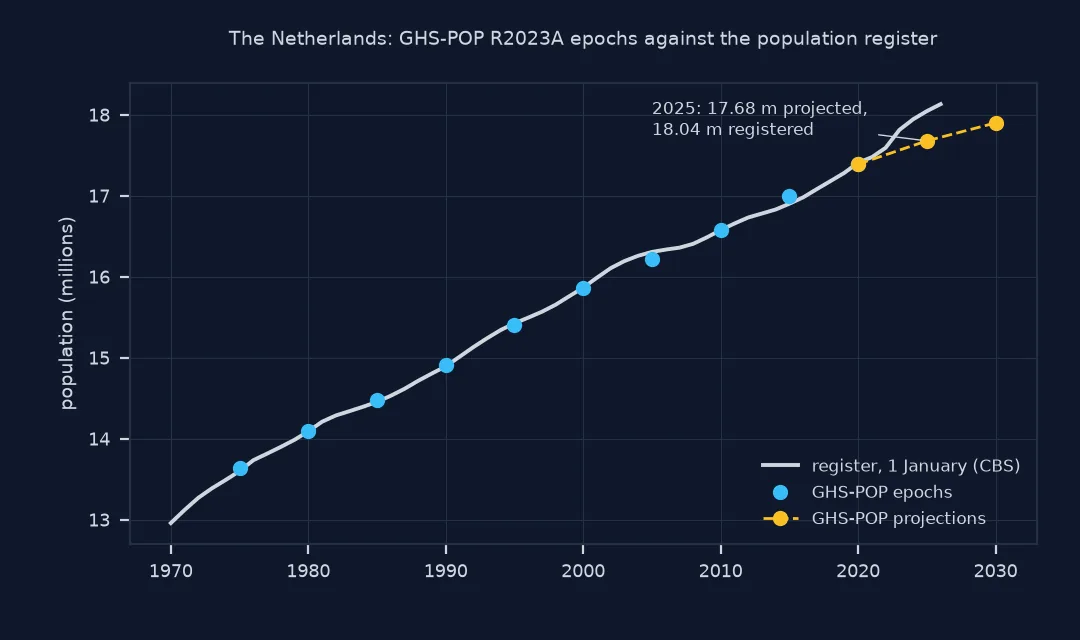
2025 17,676,856 18,044,027 -2.03%
2030 17,898,291 NaN NaN
From 1975 to 2020 every epoch is within 0.6% of the register, most within 0.3%, as expected of a model anchored on census inputs. The 2025 epoch is the exception, 2.03% below the 18,044,027 registered on 1 January 2025: it is a projection, and the 2030 epoch has nothing to compare with yet.
2. Where people were added and lost
Sort the cells by their change and see how much of the growth the top cells took:
d = change.compressed()
gain = np.sort(d[d > 0])[::-1]
print(f"people added in growing cells: {gain.sum():,.0f}; lost in shrinking cells: {d[d < 0].sum():,.0f}")
n = int(np.searchsorted(np.cumsum(gain), gain.sum() / 2)) + 1
print(f"half the gain went to {n:,} cells, {n / d.size:.1%} of the country")
print(f"largest gain in one cell: {d.max():+,.0f}; largest loss: {d.min():+,.0f}")
people added in growing cells: 4,470,413; lost in shrinking cells: -716,146
half the gain went to 2,094 cells, 3.1% of the country
largest gain in one cell: +5,721; largest loss: -3,819
Growing cells gained 4,470,413 people and shrinking cells lost 716,146, so the net change hides a lot of movement. Half the gain went to 2,094 cells, 3.1% of the country; one cell gained 5,721 people and another lost 3,819.
3. Follow one place: Almere
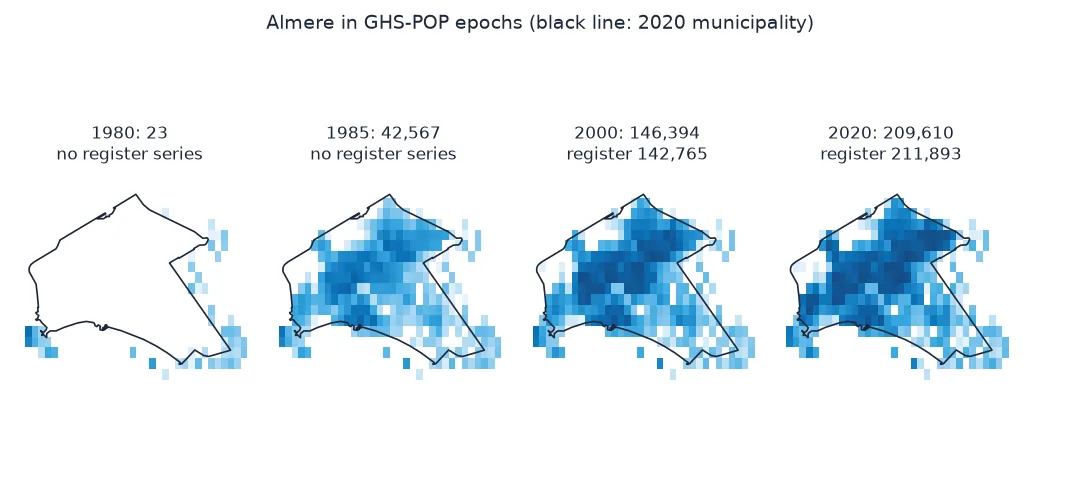
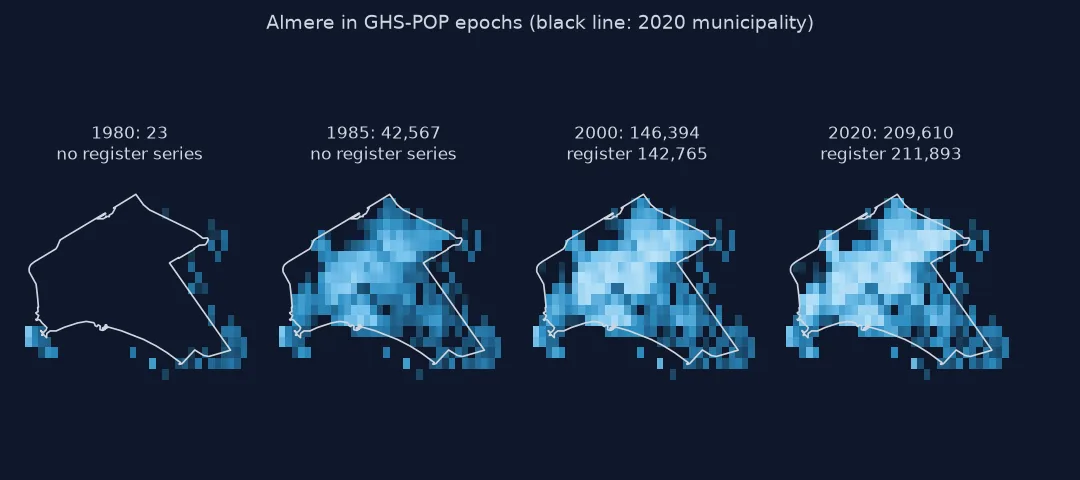
Almere, on land reclaimed from the IJsselmeer, was built from the 1970s. Mask every epoch with its 2020 boundary, compare with the municipality's register counts, published since 1988, and check the built-up surface the model had to work with in the early epochs:
almere = GM[GM.statnaam == "Almere"]
for y in (1975, 1980, 1985, 1990, 2000, 2010, 2020, 2025, 2030):
    g = epoch(y, almere)[0].sum()
    print(f"{y}: GHS-POP {g:>9,.0f}" + (f"   register {ALMERE[y]:>9,}  ({g / ALMERE[y] - 1:+.1%})" if y in ALMERE else ""))
for y in (1975, 1980, 1985):
    with rasterio.open(tile(y, "BUILT_S")) as src:
        b, _ = mask(src, almere.to_crs(src.crs).geometry, crop=True, filled=False)
    print(f"built-up surface in Almere, {y}: {b.sum() / 1e6:.1f} km2")
1975: GHS-POP 20
1980: GHS-POP 23
1985: GHS-POP 42,567
1990: GHS-POP 73,735 register 71,086 (+3.7%)
2000: GHS-POP 146,394 register 142,765 (+2.5%)
2010: GHS-POP 188,734 register 188,160 (+0.3%)
2020: GHS-POP 209,610 register 211,893 (-1.1%)
2025: GHS-POP 218,437 register 229,574 (-4.9%)
2030: GHS-POP 224,442
built-up surface in Almere, 1975: 4.2 km2
built-up surface in Almere, 1980: 4.5 km2
built-up surface in Almere, 1985: 4.9 km2
From 1990 on, GHS-POP follows Almere's register closely: 3.7% high in 1990, within 1.1% in 2010 and 2020. The early epochs are another matter. The model puts 20 people there in 1975 and 23 in 1980, then 42,567 in 1985, while the built-up surface it distributes people over barely changes, from 4.2 to 4.9 km². The 2025 projection is 4.9% short.
Testing the 2025 projection
The data used on this page
GHS-POP R2023A epochs 1975 to 2030 at 30 arc-seconds (tile R4_C19), the 2020 country and municipality boundaries from the PDOK CBS gebiedsindelingen web feature service, and the population on 1 January from Statistics Netherlands: the national series since 1950 from StatLine table 37296ned, the national figure for 2025 and Almere's series from table 03759ned.
import io
import json
import zipfile
from pathlib import Path

import geopandas as gpd
import numpy as np
import pandas as pd
import rasterio
import requests
from rasterio.mask import mask

Path("data").mkdir(exist_ok=True)
GHSL = "https://jeodpp.jrc.ec.europa.eu/ftp/jrc-opendata/GHSL"
YEARS = list(range(1975, 2031, 5))
def tile(year, kind="POP"):
    name = f"GHS_{kind}_E{year}_GLOBE_R2023A_4326_30ss"
    tif = Path("data", f"{name}_V1_0_R4_C19.tif")
    if not tif.exists():
        url = f"{GHSL}/GHS_{kind}_GLOBE_R2023A/{name}/V1-0/tiles/{tif.stem}.zip"
        zipfile.ZipFile(io.BytesIO(requests.get(url, timeout=600).content)).extract(tif.name, "data")
    return tif
for y in YEARS:
    tile(y)
def pdok(layer):
    path = Path("data", f"{layer}_2020.geojson")
    if not path.exists():
        path.write_bytes(requests.get("https://service.pdok.nl/cbs/gebiedsindelingen/2020/wfs/v1_0", timeout=300, params={
            "service": "WFS", "version": "2.0.0", "request": "GetFeature", "typeName": f"gebiedsindelingen:{layer}_gegeneraliseerd",
            "outputFormat": "application/json", "srsName": "EPSG:28992"}).content)
    return gpd.read_file(path)
NL, GM = pdok("landsdeel").dissolve(), pdok("gemeente")
odata = "https://opendata.cbs.nl/ODataApi/odata"
p = Path("data/cbs_nl_population_years.json")
if not p.exists():
    p.write_bytes(requests.get(f"{odata}/37296ned/TypedDataSet", timeout=300, params={
        "$select": "Perioden,TotaleBevolking_1", "$filter": "substring(Perioden,4,4) eq 'JJ00'"}).content)
CBS = {int(r["Perioden"][:4]): r["TotaleBevolking_1"] for r in json.loads(p.read_text())["value"]}
p = Path("data/cbs_nl_almere_years.json")
if not p.exists():
    p.write_bytes(requests.get(f"{odata}/03759ned/TypedDataSet", timeout=300, params={
        "$filter": "Geslacht eq 'T001038' and Leeftijd eq '10000' and BurgerlijkeStaat eq 'T001019' and (RegioS eq 'NL01  ' or RegioS eq 'GM0034')",
        "$select": "RegioS,Perioden,BevolkingOp1Januari_1"}).content)
rows = json.loads(p.read_text())["value"]
ALMERE = {int(r["Perioden"][:4]): r["BevolkingOp1Januari_1"] for r in rows if r["RegioS"] == "GM0034" and r["BevolkingOp1Januari_1"]}
CBS |= {int(r["Perioden"][:4]): r["BevolkingOp1Januari_1"] for r in rows if r["RegioS"].startswith("NL") and int(r["Perioden"][:4]) not in CBS}
print(f"{len(YEARS)} epochs; national series {min(CBS)}-{max(CBS)}; Almere {min(ALMERE)}-{max(ALMERE)}")
12 epochs; national series 1950-2026; Almere 1988-2026
There are 12 epochs; the national series runs from 1950 to 2026 and Almere's from 1988.
Example 1: test the 2025 projection
The R2023A epochs after 2020 are projections. The count for 1 January 2025 now exists, so the projection can be scored, nationally and for Almere:
for label, area, truth in (("Netherlands", NL, CBS[2025]), ("Almere", almere, ALMERE[2025])):
    g20, g25 = epoch(2020, area)[0].sum(), epoch(2025, area)[0].sum()
    t20 = CBS[2020] if label == "Netherlands" else ALMERE[2020]
    print(f"{label:>11}: projected growth 2020-25 {g25 / g20 - 1:+.1%}, registered {truth / t20 - 1:+.1%}; 2025 projection {g25 / truth - 1:+.1%} against the count")
Netherlands: projected growth 2020-25 +1.7%, registered +3.7%; 2025 projection -2.0% against the count
Almere: projected growth 2020-25 +4.2%, registered +8.3%; 2025 projection -4.9% against the count
The projection expected the Netherlands to grow 1.7% from 2020 to 2025; the register grew 3.7%. Almere was projected to grow 4.2% and grew 8.3%. A projection extends the trend it was built on, and both places grew faster than that.
Epochs are produced outward from the census
The epochs are produced in two directions from the census. GHSL maps built-up surface for each epoch from satellite archives, Landsat for the early years, and the population model spreads each census unit's people over that epoch's residential built-up volume. For years before or after the census inputs, the unit totals are carried by growth rates between censuses and then distributed over the built-up layer of the target year. So a cell's population in 1975 depends on two things: what the satellite saw built in 1975, and how far back the unit's growth rate was extended.
Two patterns in the results follow from that design. National totals track the register within about half a percent from 1975 to 2020, because they are anchored on it. Projections fail in the direction of recent change: they extend the past trend, and the Netherlands grew faster after 2020 than the inputs' trend implied, by 3.7% in five years against a projected 1.7%.
Local early epochs are less predictable. GHS-POP puts 23 people in Almere in 1980, although the 1980 built-up layer already shows 4.5 km² of buildings and roads there, and then 42,567 in 1985 on barely more, 4.9 km². The outputs do not say why the model left the polder empty; what they do say is that a new town's first decade cannot be read from the early epochs, while from 1990 on Almere is within 4% of the register. Check a place against any record that exists before reading its change from 1975.
One release, fixed boundaries and ratios
- Use one release: compare epochs from the same release only; R2023A revised the earlier epochs of R2022A as well as adding new ones.
- Boundaries are fixed, places are not: masking every epoch with the 2020 boundary measures change in a fixed area, which is what a map of change needs; it is not the population of the municipality as it was then.
- Ratios in empty cells: percentage change is undefined or enormous where the base is near zero; map absolute change, or set a minimum base before computing a ratio.
- Projections are scenarios: E2025 and E2030 extrapolate; label them as projections on any chart.
Internal links
- How to download and clip the GHSL population grid in Python — one epoch, clipped
- How to delineate an urban extent from GHSL in Python — urban centres from the same grid
- How to compute population-weighted centroids in Python — where the centre of population moves
FAQ
How do I calculate population change with GHSL in Python?
Read two epochs of the same release and tile, mask them with the same boundary, and subtract the arrays; the grids are identical, so no resampling is needed.
How accurate are the early GHSL epochs?
For the Netherlands, the national totals for 1975 to 2020 are within 0.6% of the register; for a new town such as Almere, the 1975 and 1980 epochs show almost nobody.
Are the GHSL 2025 and 2030 epochs real data?
No. They are projections from past growth; for the Netherlands the 2025 epoch is 2.0% below the registered population on 1 January 2025.
Should I map percentage or absolute population change?
Absolute change, or a percentage only where the base population is large enough; near-empty cells produce extreme percentages from tiny numbers.