
How to Download and Use a WorldPop Population Raster in Python
On this page
Problem statement
WorldPop publishes population rasters for every country at 3 arc-seconds, about 100 m, for every year from 2015 to 2030 in its R2025A release. Each country is one GeoTIFF, which makes it easy to fetch, but the files have traps for anyone who reads them straight into NumPy: a large negative nodata value that wrecks any sum, cells that are not 100 m square, and two different products, constrained and unconstrained, that put the same people in very different places.
This page finds the Netherlands 2020 file through the WorldPop REST API, downloads it, sums it correctly, checks the total against Statistics Netherlands, works out what one cell really measures on the ground, and compares the constrained raster with the older unconstrained one.
Quick answer
Read the raster with masked=True so the nodata cells drop out, then sum:
with rasterio.open(WP) as src:
    pop = src.read(1, masked=True)
    print(f"{src.name.split('/')[-1]}: {src.width} x {src.height} cells, nodata {src.nodata}")
print(f"WorldPop R2025A 2020: {pop.sum():,.0f} people in {pop.count():,} populated cells")
print(f"Statistics Netherlands, 1 January 2020: {OFFICIAL:,}; difference {pop.sum() / OFFICIAL - 1:+.2%}")
nld_pop_2020_CN_100m_R2025A_v1.tif: 4643 x 3364 cells, nodata -99999.0
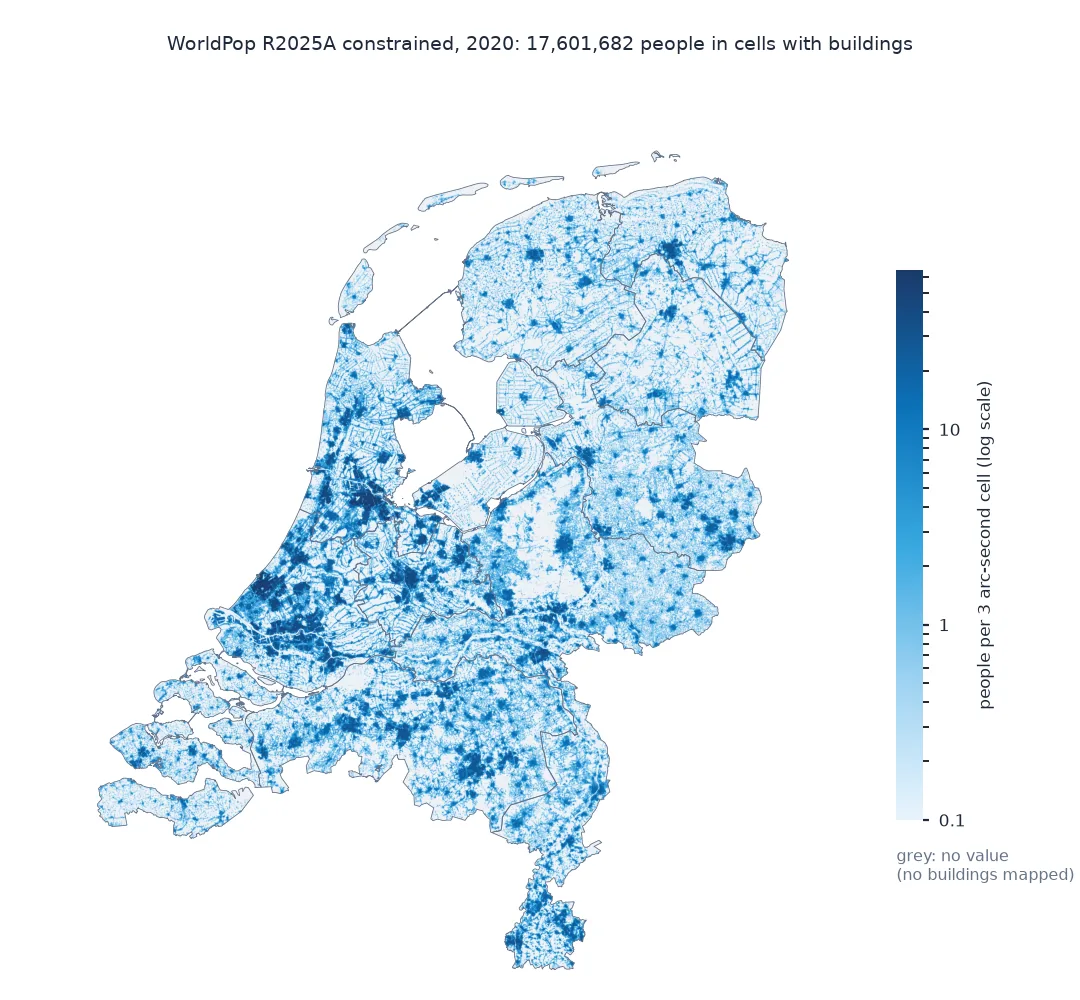
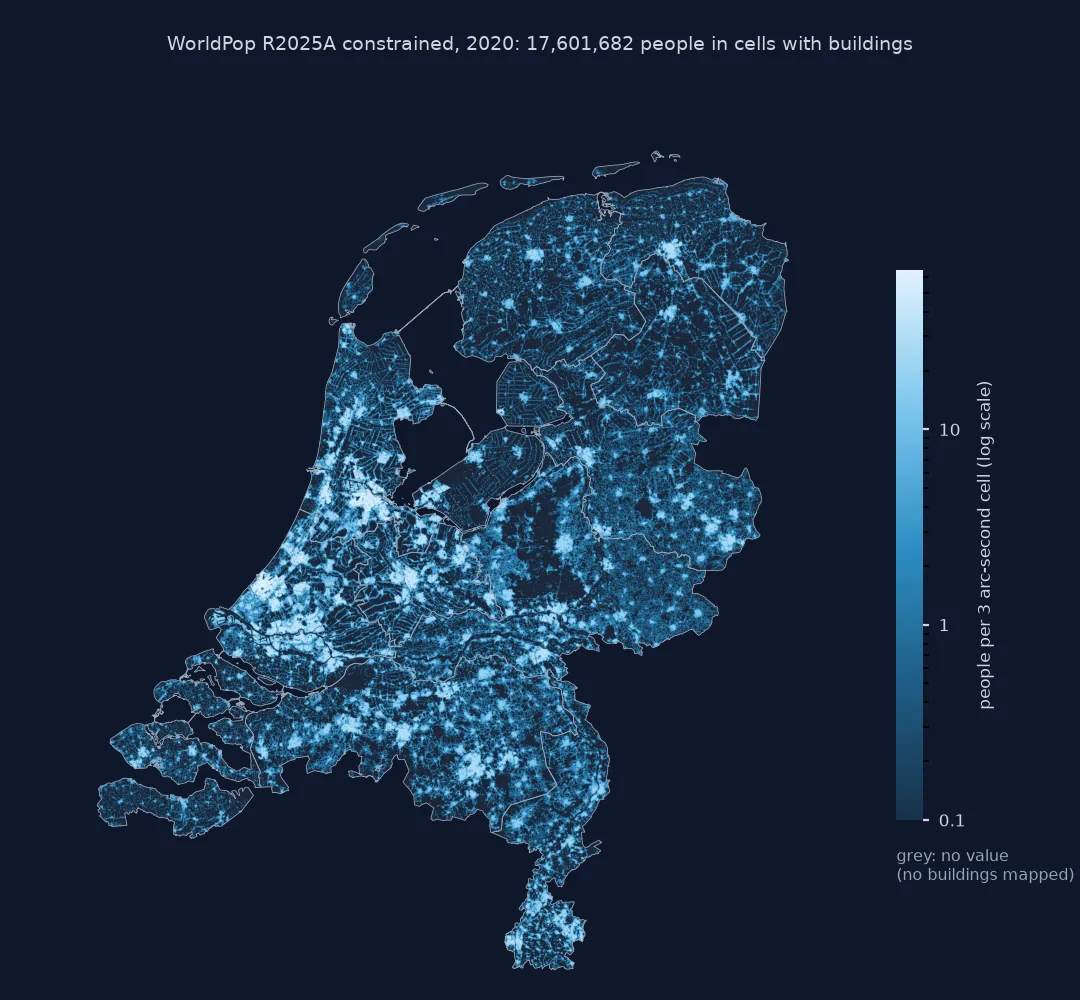
WorldPop R2025A 2020: 17,601,682 people in 3,547,924 populated cells
Statistics Netherlands, 1 January 2020: 17,407,585; difference +1.12%
The R2025A raster for 2020 holds 17,601,682 people in 3,547,924 cells, 1.12% more than the 17,407,585 Statistics Netherlands registered on 1 January 2020. The file covers the country as WorldPop drew it, so the comparison is country against country.
Find files through the API, mask nodata, know what a cell measures
1. Find the file through the REST API
The hub's REST API lists every file for a product alias and country, so the URL does not have to be guessed. G2_CN_POP_R25A_100m is the constrained 100 m R2025A product:
api = requests.get("https://hub.worldpop.org/rest/data/pop/G2_CN_POP_R25A_100m", params={"iso3": "NLD"}, timeout=120).json()["data"]
years = [int(d["popyear"]) for d in api]
print(f"{len(api)} files for NLD, {min(years)} to {max(years)}")
y2020 = next(d for d in api if d["popyear"] == "2020")
print(y2020["files"][0].split("/R2025A/")[1], "| DOI", y2020["doi"], "| released", y2020["date"])
16 files for NLD, 2015 to 2030
2020/NLD/v1/100m/constrained/nld_pop_2020_CN_100m_R2025A_v1.tif | DOI 10.5258/SOTON/WP00839 | released 2025-09-01
The API lists 16 files for the Netherlands, one per year from 2015 to 2030, all released on 1 September 2025 under one DOI. The years after the census inputs are projections.
2. Mask the nodata value before any arithmetic
Every cell outside the populated area holds -99999. Read without a mask and those cells dominate any sum or mean:
with rasterio.open(WP) as src:
    raw = src.read(1)
empty = raw == -99999
print(f"cells: {raw.size:,}; nodata: {empty.sum():,} ({empty.mean():.0%}); zero: {(raw == 0).sum():,}")
print(f"raw sum: {raw.astype('float64').sum():,.0f}")
print(f"sum without nodata: {raw[~empty].astype('float64').sum():,.0f}")
cells: 15,619,052; nodata: 12,071,128 (77%); zero: 12,777
raw sum: -1,207,083,127,190
sum without nodata: 17,601,682
More than three quarters of the cells, 12,071,128, are nodata, so an unmasked sum comes out at minus 1.2 trillion. Only 12,777 cells are a true zero. Drop the nodata cells and the sum is the total from the quick answer.
3. What one cell measures on the ground
The cells are 3 arc-seconds on both sides. A degree of longitude shrinks with latitude, so in the Netherlands a cell is much narrower than it is tall:
lat = np.radians(52.2)
dy = 3 / 3600 * 111_320
dx = 3 / 3600 * 111_320 * np.cos(lat)
print(f"one cell at 52.2 N: {dx:.0f} m wide x {dy:.0f} m tall = {dx * dy / 1e4:.2f} ha")
q = np.percentile(pop.compressed(), [50, 90, 99])
print(f"people per cell: median {q[0]:.1f}, 90th percentile {q[1]:.1f}, 99th {q[2]:.1f}, max {pop.max():.1f}")
print(f"densest cell as people per hectare: {pop.max() / (dx * dy / 1e4):,.0f}")
one cell at 52.2 N: 57 m wide x 93 m tall = 0.53 ha
people per cell: median 1.3, 90th percentile 15.6, 99th 38.6, max 65.5
densest cell as people per hectare: 124
A cell here is 57 m wide and 93 m tall, 0.53 ha, so cell values are not people per hectare. The median populated cell holds 1.3 people and the fullest 65.5, which works out at 124 people per hectare.
Constrained against unconstrained WorldPop
The data used on this page
WorldPop's R2025A constrained 100 m population for the Netherlands for 2020 (DOI 10.5258/SOTON/WP00839), the older 2020 unconstrained 100 m raster from the 2000–2020 series, and the population on 1 January 2020 from Statistics Netherlands' StatLine table 03759ned.
import json
from pathlib import Path

import numpy as np
import rasterio
import requests

Path("data").mkdir(exist_ok=True)
SRC = {"nld_pop_2020_CN_100m_R2025A_v1.tif": "https://data.worldpop.org/GIS/Population/Global_2015_2030/R2025A/2020/NLD/v1/100m/constrained/nld_pop_2020_CN_100m_R2025A_v1.tif",
       "nld_ppp_2020.tif": "https://data.worldpop.org/GIS/Population/Global_2000_2020/2020/NLD/nld_ppp_2020.tif"}
for name, url in SRC.items():
    if not Path("data", name).exists():
        Path("data", name).write_bytes(requests.get(url, timeout=600).content)
WP, OLD = Path("data/nld_pop_2020_CN_100m_R2025A_v1.tif"), Path("data/nld_ppp_2020.tif")
C = Path("data/cbs_pop_2020.json")
if not C.exists():
    C.write_bytes(requests.get("https://opendata.cbs.nl/ODataApi/odata/03759ned/TypedDataSet", timeout=300, params={
        "$filter": "Geslacht eq 'T001038' and Leeftijd eq '10000' and BurgerlijkeStaat eq 'T001019' and Perioden eq '2020JJ00' "
                   "and (substring(RegioS,0,2) eq 'GM' or substring(RegioS,0,2) eq 'NL')",
        "$select": "RegioS,BevolkingOp1Januari_1"}).content)
OFFICIAL = next(r["BevolkingOp1Januari_1"] for r in json.loads(C.read_text())["value"] if r["RegioS"].startswith("NL"))
print(f"R2025A file {WP.stat().st_size / 1e6:.1f} MB; 2000-2020 series file {OLD.stat().st_size / 1e6:.1f} MB")
R2025A file 18.5 MB; 2000-2020 series file 32.2 MB
The R2025A file is 18.5 MB and the older series' file 32.2 MB.
Example 1: constrained against unconstrained
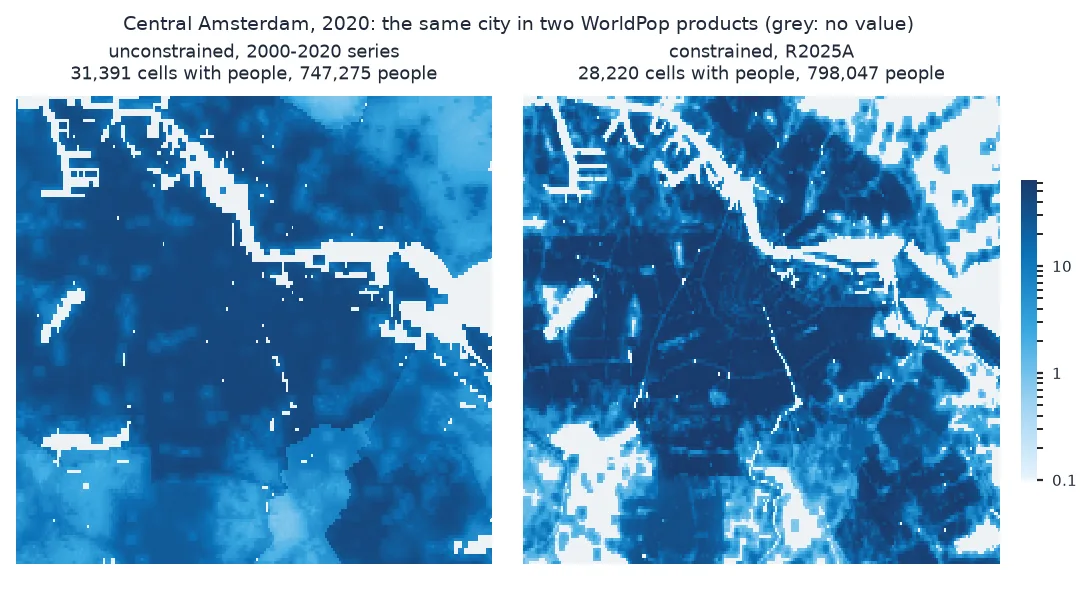
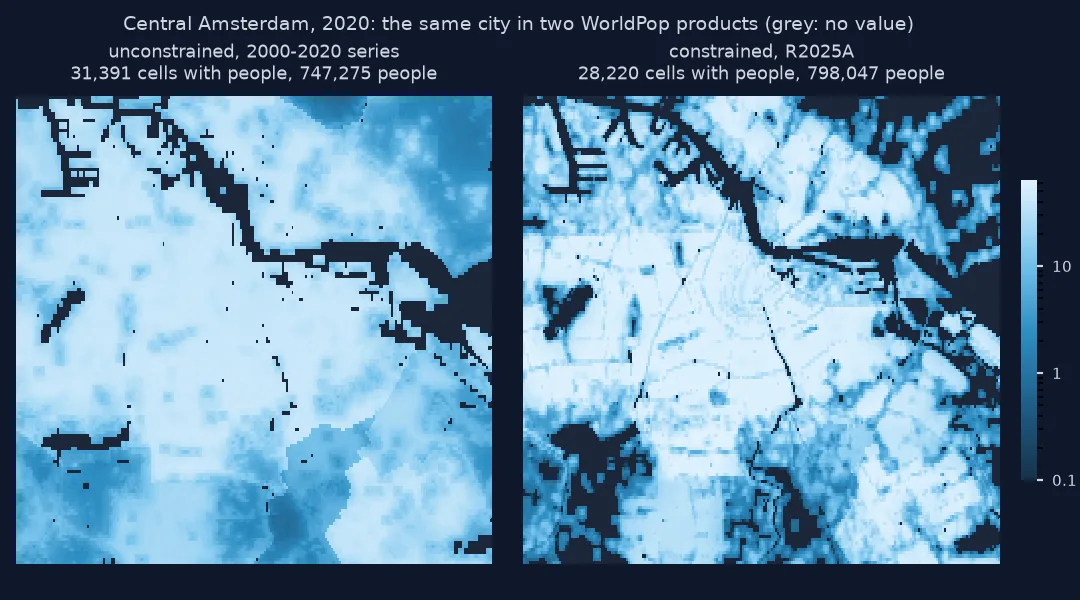
WorldPop's older 2000–2020 series is unconstrained: it gives every land cell some people. The constrained product only fills cells where buildings were mapped. Compare the two for 2020:
with rasterio.open(OLD) as src:
    old = src.read(1, masked=True)
for label, a in (("unconstrained, 2000-2020 series", old), ("constrained, R2025A", pop)):
    v = a.compressed()
    print(f"{label:>32}: {v.sum():>12,.0f} people, {v.size:>9,} cells with a value, {(v >= 1).sum():>9,} with at least one person")
print(f"unconstrained cells under 0.1 person: {(old.compressed() < 0.1).sum():,}")
unconstrained, 2000-2020 series: 17,349,948 people, 6,569,268 cells with a value, 2,676,207 with at least one person
constrained, R2025A: 17,601,682 people, 3,547,924 cells with a value, 2,057,395 with at least one person
unconstrained cells under 0.1 person: 63,499
The unconstrained raster spreads 17.35 million people over 6.57 million cells, almost twice as many as the constrained one, and 2.68 million of them get at least one person against 2.06 million. Only 63,499 cells hold less than 0.1 person: unconstrained does not mean thinly spread everywhere, but every person it places on farmland is one fewer in a town, because each unit's total is fixed.
A random forest spreads census counts
WorldPop estimates population with a random forest. For each country it takes census or register counts for administrative units and a stack of covariates on the 100 m grid, such as building footprints, night-time lights, land cover, roads and slope, learns how population density relates to them at the unit level, predicts a density surface, and then rescales the prediction so that each unit's cells add up to its count. The constrained products only allow people in cells where a building dataset shows settlement; the unconstrained ones spread a little population over every land cell.
Two things follow from that. A country total is close to the input counts by design, so a WorldPop sum for a whole country says little about accuracy; the test is how it distributes people within units. And the random forest predicts smooth densities. The densest R2025A cell in the Netherlands works out at 124 people per hectare, while Statistics Netherlands' 100 m census grid has a cell with 2,180 residents. The raster places people in the right neighbourhoods more reliably than in the right blocks.
UN-adjusted versions, borders and float sums
- UN-adjusted versions: the older series also comes as
_UNadj, rescaled to the UN's country total; check which version a file is before comparing totals. - Borders: each country raster is cut to that country's boundary as WorldPop drew it; an area across a border needs two files mosaicked.
- Float32 sums: the files are 32-bit floats; summing millions of cells in float32 can lose precision, so pass
dtype='float64'to the sum for large areas. - Years are model years: R2025A years after the last census are projections; a 2020 file is not a 2020 count.
Internal links
- How to download and clip the GHSL population grid in Python — the other global grid
- How to do dasymetric mapping in Python — the redistribution idea, by hand
- Zonal statistics in Python — totals per polygon
FAQ
How do I download WorldPop data in Python?
Query https://hub.worldpop.org/rest/data/pop/<alias>?iso3=<ISO3> for the product, take the URL from the files field of the year you want, and download it with requests.
Why is the sum of my WorldPop raster negative?
The nodata value is -99999 and it was included in the sum. Read with masked=True, or drop cells equal to src.nodata, before any arithmetic.
What is the difference between constrained and unconstrained WorldPop?
Constrained rasters only put people in cells where buildings were detected; unconstrained ones give every land cell a share, including farmland and forest.
Is WorldPop 100 m really 100 m?
The cells are 3 arc-seconds on each side, about 93 m north to south everywhere but narrower east to west away from the equator: about 57 m in the Netherlands.